


Talking Points:
- EUR/JPY has reversed last week’s bearish trend after running into trend-line support.
- Prices are fast approaching 136.00, which has shown a recent tendency to produce resistance in the pair.
- If you’re looking to improve your trading approach, check out our Traits of Successful Traders research. And if you’d like more of a basic primer for the FX market, check out our New to FX Guide.
EUR/JPY Bounce From Trend-Line Support
EUR/JPY capped off what was an impressively strong 2017 by continuing to show strength in the first few trading days of the New Year. But, after an evening star formed around the close of the first week of the year, prices continued to drop as worries about a ‘stealth taper’ from the Bank of Japan created considerable Yen strength. This amounted to a pull-back in the previously ebullient trend of EUR/JPY, and as we wrote last week, prices had pulled back to the first of two interesting areas of potential support. That support is derived from a trend-line projection that can be found by connecting the August and November lows from last year; the projection of which runs into December and now January, 2018 swing-lows.
EUR/JPY Daily: Trend-Line Support From August, November Lows
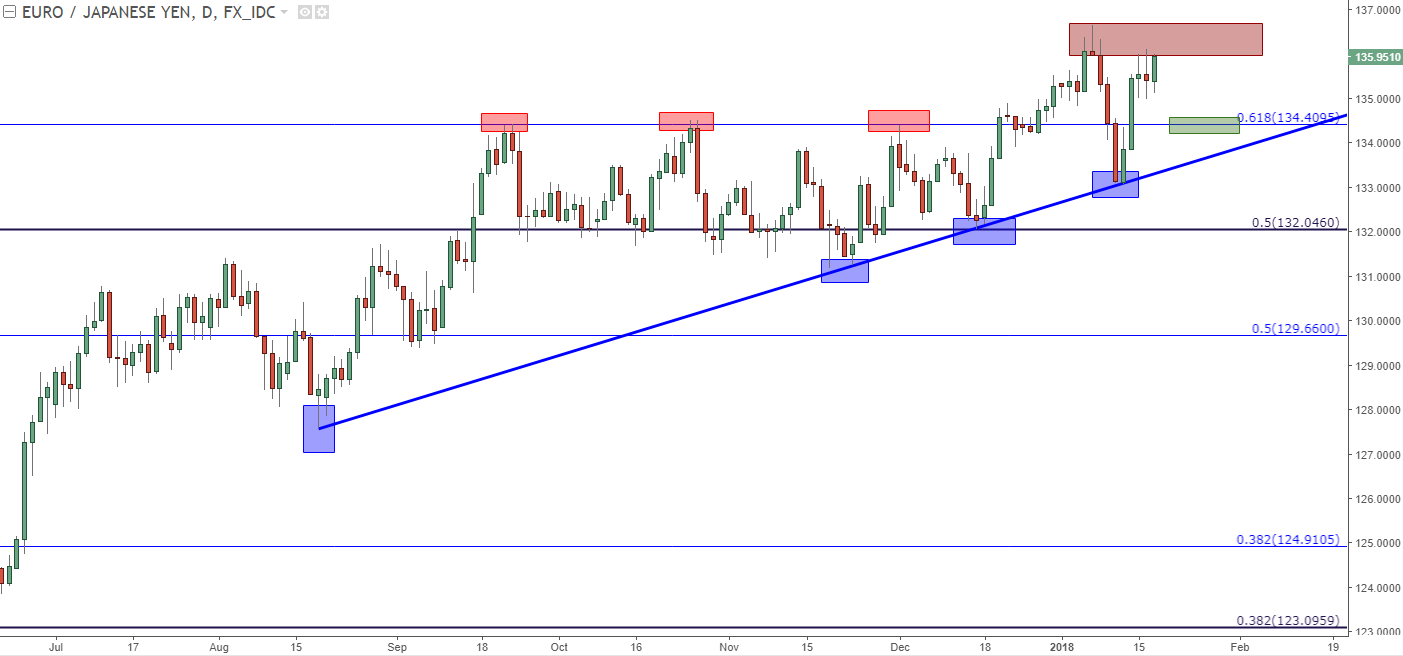
Chart prepared by James Stanley
Prior Fibonacci Resistance as Fresh Support
After support built-in off of that trend-line, buyers took control, and pushed prices all the way up towards the two-year high that was set a couple of weeks ago. Problematic, however, is how bulls have thus far been unable to break-above this area, and this points to the fact that the move may still be stretched after this recent topside run. So, while the bullish trend continues to show healthy signs of strength, justifying fresh exposure while so near an area that’s been unwilling to budge can present challenges.
More interesting, however, is an area of prior resistance at 134.41. This is the 61.8% Fibonacci retracement of the 2014-2016 move, and this helped to form a triple-top in the pair last year. To date, this has yet to show-up as any significant level of support, and traders looking to on-load bullish exposure can look to this area of prior resistance in the effort of establishing bullish exposure at a potential higher-low.
EUR/JPY Daily: Resistance Around 136.00, Potential Support Around 134.41

Chart prepared by James Stanley
To read more:
Are you looking for longer-term analysis on the Euro or Japanese Yen? Our DailyFX Forecasts for Q1 have a section for both EUR/USD and USD/JPY. We also offer a plethora of resources on our EUR/JPY page, and traders can stay up with near-term positioning via our IG Client Sentiment Indicator.
--- Written by James Stanley, Strategist for DailyFX.com
To receive James Stanley’s analysis directly via email, please SIGN UP HERE
Contact and follow James on Twitter: @JStanleyFX


