


Talking Points:
- EUR/JPY has continued within the range that started in mid-September; and this has even lasted through the ECB’s extension of QE into 2018.
- Since another test of resistance last week, prices have started to pull back in an aggressively bearish fashion. Bulls will likely want to avoid trying to catch this falling knife, instead electing to allow the setup to clean-up a bit before investigating top-side setups.
- Want to see how EUR and JPY are holding up to the DailyFX Forecasts? Click here for full access.
To receive James Stanley’s Analysis directly via email, please sign up here
In our last article, we looked at the continuation of the range in EUR/JPY after support had started to bend earlier in November. The bending around support happened after a fairly bearish driver had availed itself when the ECB elected to extend QE well into 2018. The fact that a deeper sell-off did not show here is just testament to how weak the Japanese Yen was/has been; along with the fact that markets are continuing to harbor the assumption that the ECB will, eventually, have to move away from uber-dovish policy relatively stable global growth continues to show.
Much of this recent range has been governed between two key Fibonacci levels. At resistance: We have the 61.8% retracement of the 2014-2016 major move. And at support, we have a zone starting with the 50% retracement of the 2008-2012 move, along with a group of swing highs that showed-up in August of this year before the range started.
EUR/JPY Four-Hour: Range-Bound since Mid-September
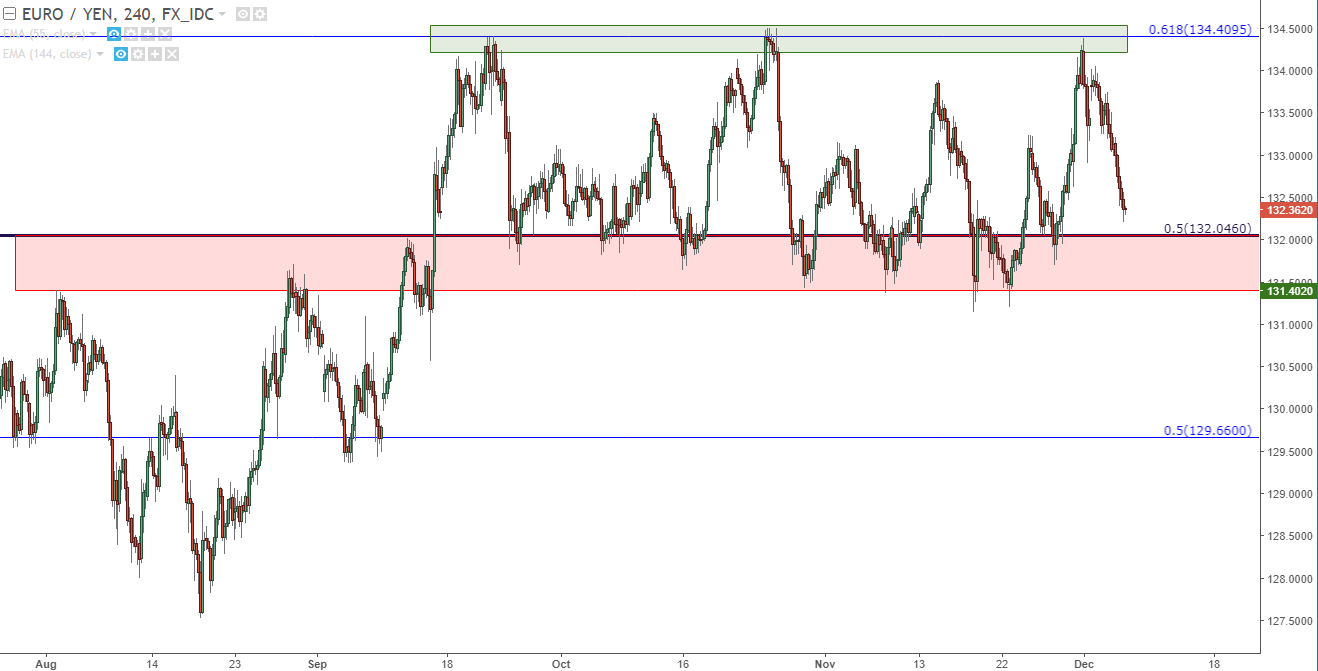
Chart prepared by James Stanley
Just last week brought another resistance test around 134.41; but as we’ve seen twice before, bulls have had a tendency to lose motivation around that level. Prices have since started a rather aggressive sell-off, and traders would likely want to wait for support to re-enter the zone before plotting bullish continuation. At this point, buying EUR/JPY after such a rigid and consistent sell-off over the past few trading days would be akin to trying to catch a falling knife. Maybe it works, but is the risk really worth the possible reward?
To establish long positions, traders are likely going to want to wait for some element of bullish price action to begin showing on lower time-frames, such as the hourly chart. This can be done in a few different ways, but most operable given the consistency with which this pullback has shown could be awaiting the break of this aggressively-sloped bearish channel, at which point long positions can become favored again under the presumption of bullish potential. The key for such an approach would be watching for this to take place above the prior swing-low within support at 131.70. If we do see a top-side break of this bearish channel after early-indications of a higher-low, the door is opened for bullish exposure. If we don’t get this before taking out that prior low, we’ll discuss another way of moving forward below the following image:
EUR/JPY Hourly: Aggressive Bearish Channel Fast Approaching Longer-Term Support Zone

Chart prepared by James Stanley
If we don’t get that higher low:
If we don’t see this string of weakness break before taking out the 131.70 level, traders are likely going to want to revert to the longer-term setup or, to put it another way, look to trade the horizontal range rather than plotting trends inside of the range. This would be standard range-trading logic, looking for some evidence of support (reaction/elongated wick highlighting reaction) within the zone to open the door for long positions. Traders can then look to the mid-line of the range for stop management, or perhaps even an initial scale out of the position; awaiting for prices to re-test resistance at 134.41.

Chart prepared by James Stanley
--- Written by James Stanley, Strategist for DailyFX.com
To receive James Stanley’s analysis directly via email, please SIGN UP HERE
Contact and follow James on Twitter: @JStanleyFX


