


Talking Points:
- EUR/JPY has rallied above the post-ECB swing-high of 133.10, complicating near-term directional biases.
- There are potential setups on both sides of the pair at the moment. The top-side is clearer, but resistance on the under-side of a key trend-line can keep the door opened on the short-side, as well.
- Want to see how EUR and JPY are holding up to the DailyFX Forecasts? Click here for full access.
To receive James Stanley’s Analysis directly via email, please sign up here
In our last article, we looked at the potential of a bigger picture break-down in EUR/JPY price action. That has not happened. After spending much of 2017 trending higher under the expectation that the ECB would invoke a ‘less loose’ policy before the end of the year, the single currency got slammed when the bank extended their stimulus outlay into 2018. This rate decision also brought with it the pronouncement that the ECB expects to keep rates at or near present levels well into the future; inferred to mean beyond 2018.
Near-immediately, EUR/USD broke through a key support zone and EUR/JPY traveled right back to the area that had held the lows for the prior six weeks. This zone that runs from 131.71-132.05 spans the August 1st high (131.71) to the 50% Fibonacci retracement of the 2008-2012 major move (132.05); and this area had helped to turn around prices in EUR/JPY on multiple occasions since mid-September. But after ECB (in maroon on the below chart), those lows began to slip a bit-lower, giving the appearance that support was about to breach as sellers took over. This case was even strengthened by the lower-high that showed up around 133.10 after ECB (highlighted by a green box below).
EUR/JPY Four-Hour: ECB-Fueled Weakness Budges Down to Slightly Lower-Lows

Chart prepared by James Stanley
But those sellers couldn’t hold the move; and as prices started to break-higher, that swing-high at 133.10 was exposed . As we came into this week, a couple of positive European data prints have helped to re-invigorate Euro bulls. German GDP came-in red hot at .8%, and this carries the Euro-Zone up to .6% quarterly growth. This puts Europe on pace to grow faster than the United States, and while the Fed has invoked four rate hikes over the past two years, the ECB remains pedal-to-the-floor on the stimulus front, with no signs yet of abating. This presents a fairly clear-case of divergence, and it appears as though markets don’t want to wait around for the ECB to signal the oncoming of higher rates before beginning to factor that in.
On the heels of yesterday’s GDP prints, the Euro caught another gust of life to surge higher. In EUR/JPY, this propelled prices above that prior swing high of 133.10, giving the appearance that a re-test of the 134.41 Fibonacci resistance level was in the cards. This is the 61.8% retracement of the 2014-2016 major move in the pair, and this level helped to turn around advances in EUR/JPY in September and then again in October. A third approach here becomes interesting for top-side breakouts above the double top. Also of interest on the bullish side is near-term potential support.
Prices have moved off of short-term highs, and currently appear to be trying to dig-out support around the prior swing around 133.10. If we do see a bullish response, as indicated by a candlestick wick on the four-hour chart, this can open the door to top-side setups looking for a re-test of 134.41.
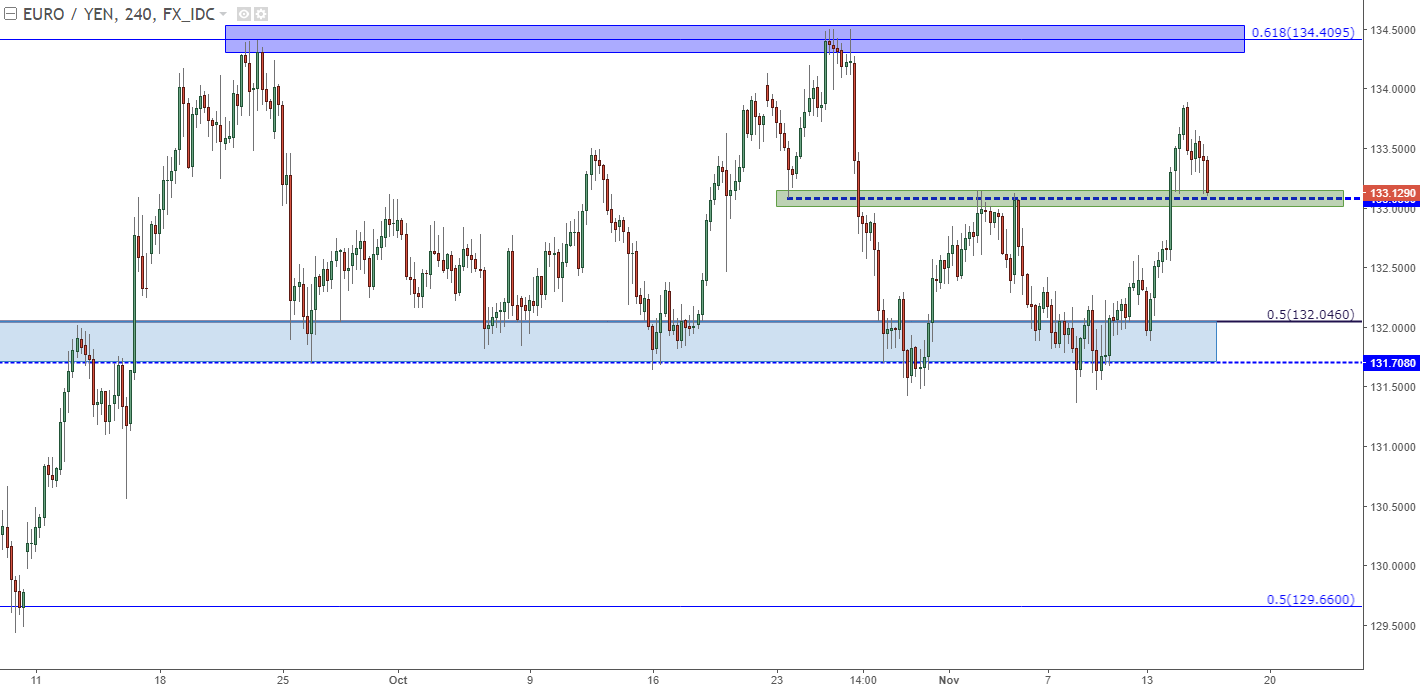
Chart prepared by James Stanley
This isn’t an entirely one-sided story, however, as there may still be a case to be made on the bearish side of the coin. An aggressively bullish trend-line can be found by connecting the August low to the October 15th low. The projection of this trend-line coincides with that prior swing-high around 133.10, and the deeper projection of this level runs into current resistance. The fact that prices have put in a rather strong reaction thus far makes this an interesting observation, and if we do see prices fall back towards that prior zone of support around 131.71-132.05, the high off of this trend-line can be usable for stop placement on short-side approaches.
EUR/JPY Four-Hour: Resistance at Under-Side of Projection from Prior Bullish Trend-Line

Chart prepared by James Stanley
--- Written by James Stanley, Strategist for DailyFX.com
To receive James Stanley’s analysis directly via email, please SIGN UP HERE
Contact and follow James on Twitter: @JStanleyFX


