


Talking Points:
- EUR/JPY lurched lower in the immediate wake of the ECB’s announcement to extend their stimulus program; and after a brief bout of support, sellers have continued to hit EUR/JPY.
- EUR/JPY Sentiment is currently at -2.36:1, and this is a bullish indication. When/if this flips, the case for a bigger-picture bearish breakdown can be strengthened. Click here to access IG Client Sentiment.
- Want to see how Euro and/or Yen are holding up to our DailyFX Q4 forecasts? Click here for full access.
To receive James Stanley’s Analysis directly via email, please sign up here.
In our last article, we looked at EUR/JPY after a key level of resistance came-in around 134.41, just ahead of the October ECB rate decision. This was a key level for a number of reasons, as this is the 61.8% retracement of the 2014-2016 major move in the pair; but perhaps most importantly, this price had helped to turn around EUR/JPY’s bullish advance in September. Over a two day sequence traders had tried to break prices-higher, each of which failed. And when price action re-approached this level a month later, the same began to show as sellers populated the pair and started to push prices lower. As we advised, even though this was a fresh one-year high in EUR/JPY, traders would likely want to wait before trying to push the long side ahead of a critical ECB meeting.
EUR/JPY Four-Hour: Resistance Holds, Price Travels Back to Support Zone post-ECB
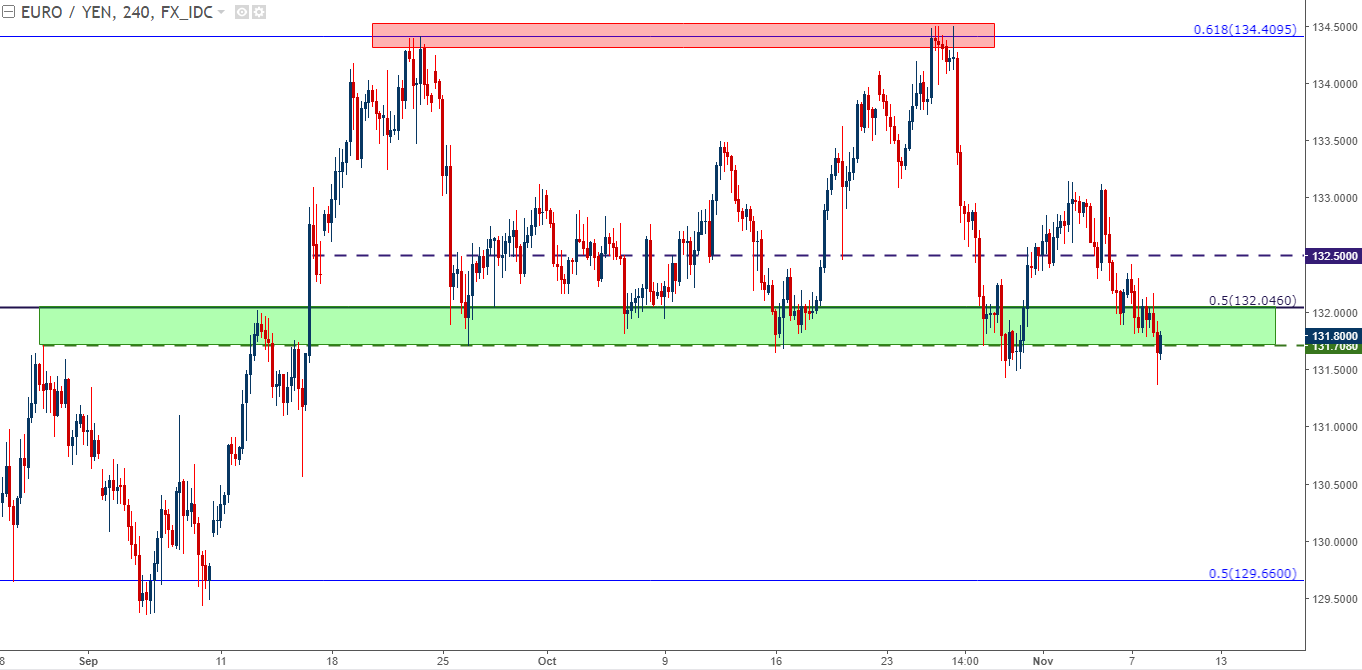
Chart prepared by James Stanley
In the immediate wake of ECB, prices moved down to the zone of support that we’ve been following that runs from 131.71-132.05. The level of 132.05, in particular, is interesting as this is the 50% retracement of the 2008-2013 major move. This zone of support has helped to hold the lows in EUR/JPY for going on six weeks now. But rather than bouncing as we’d seen for much of the previous seven weeks, price action drove deeper. Bulls came-back shortly after, but the fact that support was beginning to give was notable.
EUR/JPY Daily: Prices Begin to Slip Below Support Temporarily post-ECB (purple)

Chart prepared by James Stanley
After prices bounced higher following that slight breach of support, sellers remained on the sidelines waiting for a more adequate point of re-entry. That appeared around the swing-low in EUR/JPY that had showed around 133.10. And after a couple of attempts to take out that resistance faltered, prices moved-lower to, again, set another fresh lower-low. This gives us a lower-high below the prior inflection at 134.41, and if bears can continue driving below that prior zone of support, the door can open the door to short-side setups in the pair.
EUR/JPY Four-Hour: Support Slipping, Lower-High at Prior Swing-Low

Chart prepared by James Stanley
Traders looking to take on short-side exposure in EUR/JPY can look for resistance below the prior swing-high around 133.10. This would be a second ‘lower-high’, and this can open the door for bigger-picture continuation of this recent bearish trend. On the chart below, we’ve identified a zone in orange that straddles the psychological level around 132.50, with the benefit of such an area being the ability to lodge stops on short-side positions above that prior swing-high. We’ve also added four points of prior support/resistance, each of which can be incorporated as profit targets on short-side plays.
EUR/JPY Four-Hour: Subordinated Support Applied, Lower-High Resistance Potential ~132.50

Chart prepared by James Stanley
--- Written by James Stanley, Strategist for DailyFX.com
To receive James Stanley’s analysis directly via email, please SIGN UP HERE
Contact and follow James on Twitter: @JStanleyFX


