


Talking Points:
- EUR/JPY Technical Strategy: Retracement in bullish trend continues to hold higher-low support.
- The pair has oscillated within a ~140 pip range over the past two weeks, with multiple tests of support holding-up the longer-term trend.
- Want to see how Euro and/or Yen are holding up to our DailyFX Q4 forecasts? Click here for full access.
To receive James Stanley’s Analysis directly via email, please sign up here.
In our last article, we looked at EUR/JPY moving-down to a key level of support. The pair put in quite the performance in the middle two quarters of 2017, jumping from a mid-April low below 115.00 to set a fresh 2017 high just a few weeks ago at 134.41. This move, of course, has been driven by a host of fundamental factors revolving around both the Euro and the Japanese Yen, and as we near what’s expected to be a pivotal European Central Bank meeting later in the month, that previously bullish move has continued to digest around higher-low support.
EUR/JPY Daily: Higher Low Holding Around Fibonacci, Trend-Line Support

Chart prepared by James Stanley
At current, both near-term support and resistance are being defined at least in-part by retracement levels from longer-term Fibonacci studies. The price of 132.05 is the 50% retracement of the 2008-2012 major move and this, along with the prior swing-high at 131.70 is helping to set current support. And on the resistance side, 134.41 is the 61.8% retracement of the 2014-2016 major move; and after two days of testing in mid-September, bears took over and brought prices down to that higher-low.
EUR/JPY Monthly: Long-Term Fibonacci Retracements Helping to Set Near-Term Support, Resistance
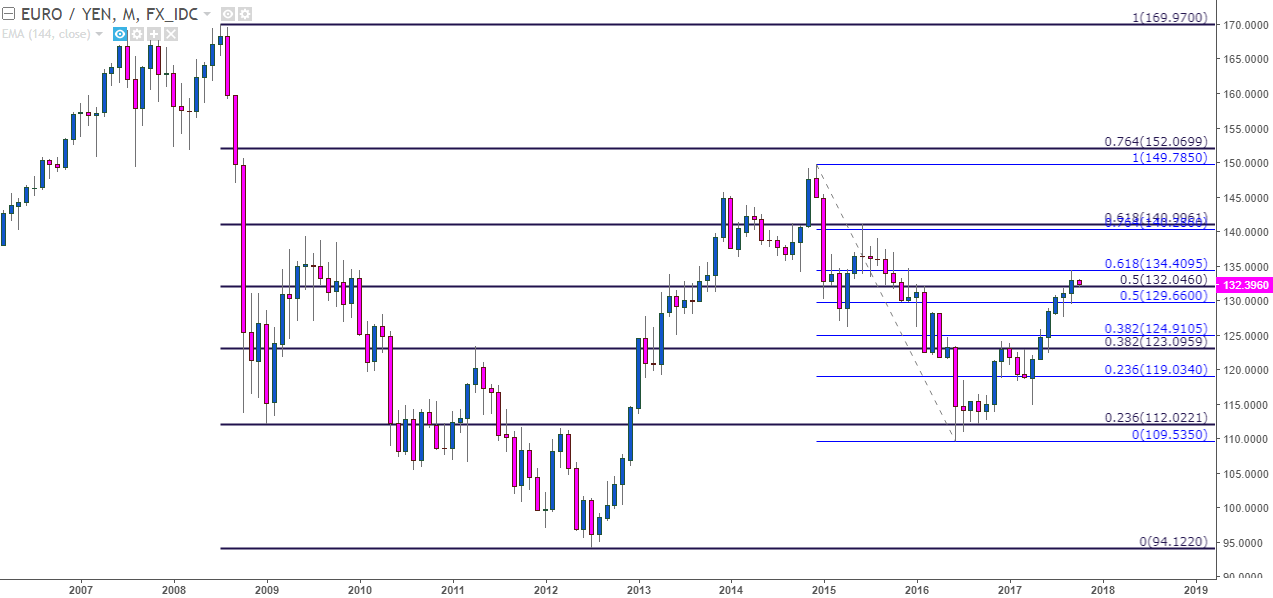
Chart prepared by James Stanley
Continued support around the longer-term retracement at 132.05 opens the door for bullish exposure in the pair. Traders can investigate stops either below 131.71 for a more aggressive approach, or below the prior swing at 130.56 for a more conservative stance with more room to work on the initial entry. For those taking the more aggressive approach, a re-test of the prior swing-high around 133.00 can be used to adjust stops to breakeven. The level of 134.41 is particularly interesting for bullish targets, as this Fib level had offered a couple of days of resistance previously; and if this is taken out, the psychological level at 135.00 becomes attractive for next topside targets.
EUR/JPY Four-Hour: Trend-Line, Fibonacci Support Helping to Hold the Higher-Low
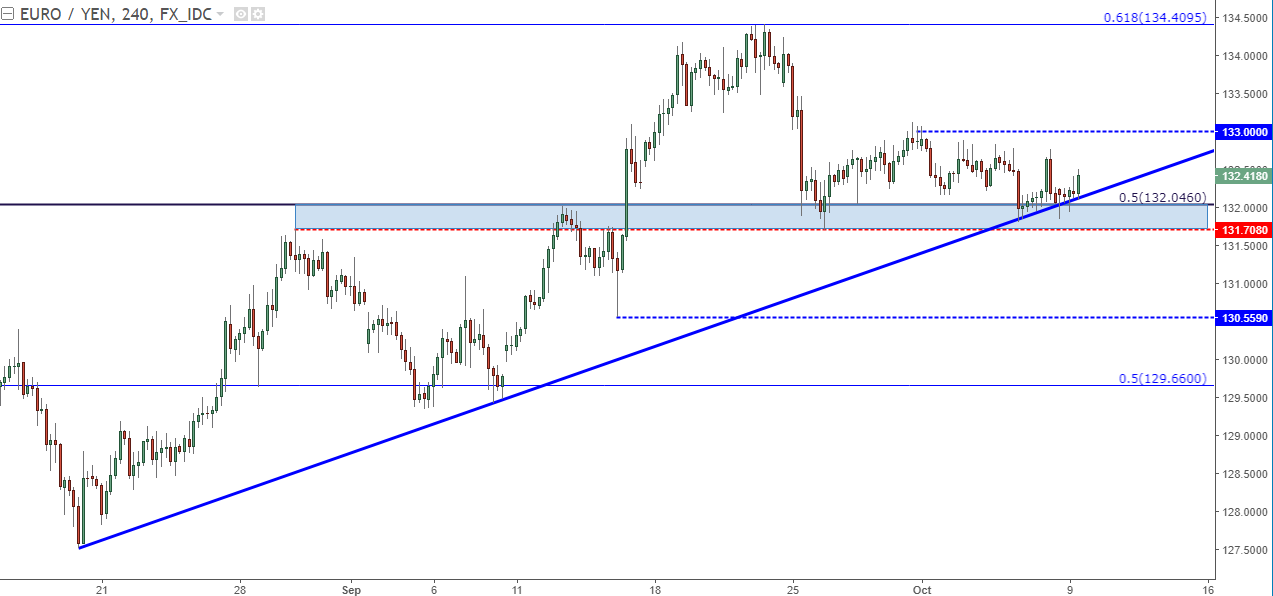
Chart prepared by James Stanley
--- Written by James Stanley, Strategist for DailyFX.com
To receive James Stanley’s analysis directly via email, please SIGN UP HERE
Contact and follow James on Twitter: @JStanleyFX


