


To receive James Stanley’s Analysis directly via email, please sign up here.
Talking Points:
- EUR/JPY Technical Strategy: Long-term bullish, intermediate-term: mixed, short-term: bearish.
- EUR/JPY put in an impressive bounce off of last week’s lows; but sellers have shown up ahead of the prior swing-high.
- If you’re looking for trading ideas, check out our Trading Guides. If you’re looking for shorter-term ideas, check out our IG Client Sentiment.
In our last article, we looked at the ‘failure high’ in EUR/JPY as the pair fell short of taking out the prior May-high by a single pip. As we had written, while the trend was undeniably bullish, the fact that bulls lost motivation whilst testing those prior highs may have been deductively telling us something. Shortly after, sellers enveloped price action in the Euro and this drove EUR/JPY down to a key support level around 123.22, which is the 23.6% retracement of the most recent bullish move, taking the low in April up to the May high.
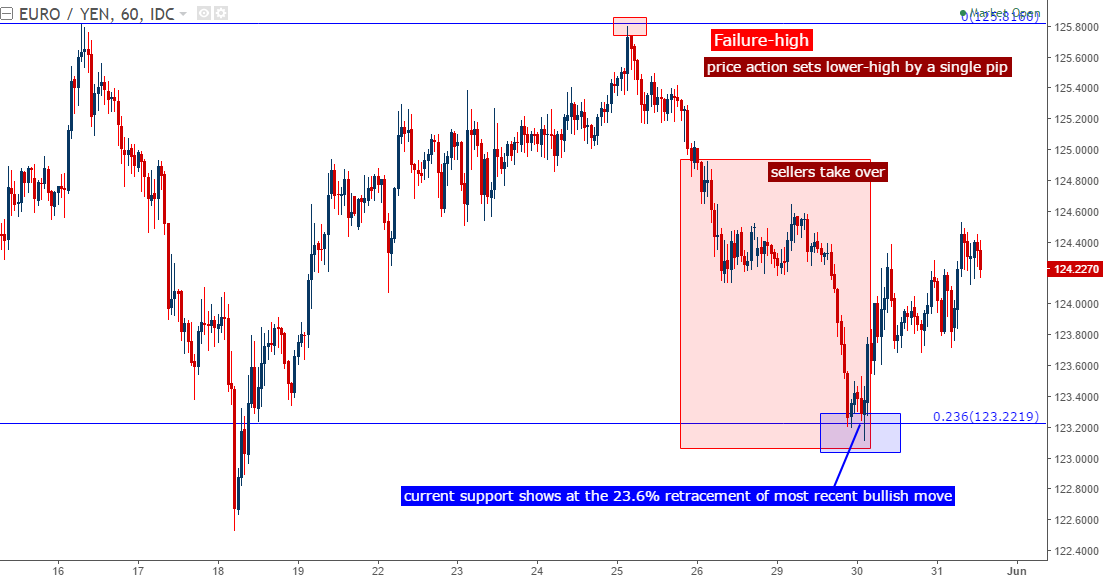
Chart prepared by James Stanley
The net of the past three weeks of price action in EUR/JPY has been a rather chaotic range near the top of a well-developed bullish move. So, while near-term price action has taken on a bearish tonality, the longer-term formation here is still bullish in nature. Nonetheless, price action remains very close to the top of that longer-term bullish formation, and traders may want to look for a deeper retracement before adding bullish exposure with longer-term time horizons. There are two potential zones to watch for such an indication; with ‘S1’ showing between 121.62-121.96, while ‘S2’ straddles the 120.00 psychological level (119.91-120.32).
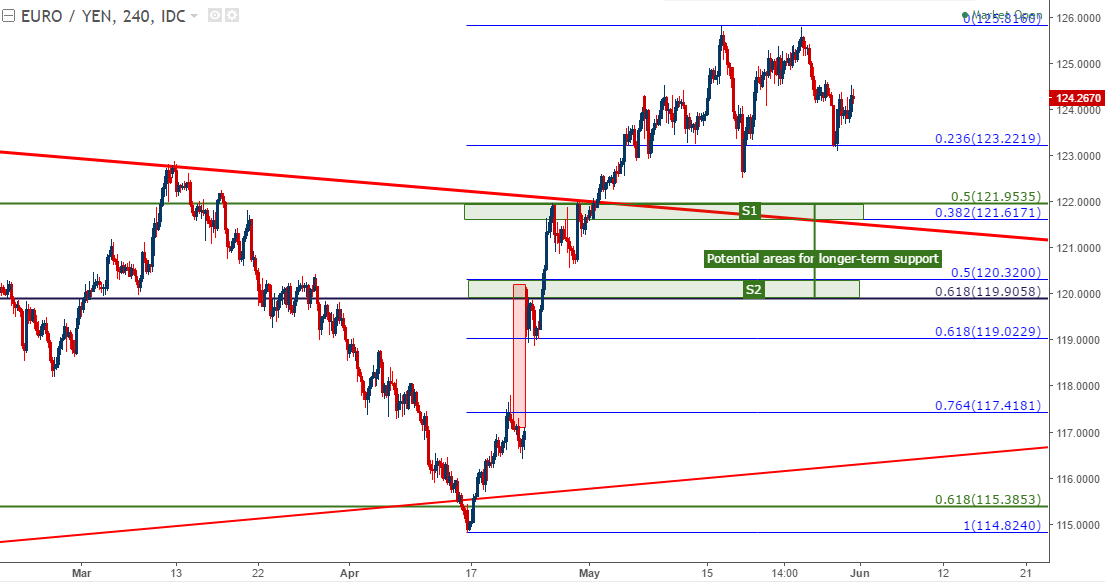
Chart prepared by James Stanley
For shorter-term bearish strategies, we’re at an interesting area of potential resistance. We had looked at 124.50 as a ‘line of demarcation’ in our previous article, and this area continues to elicit interest. This area had given a brief element of resistance before the bearish move extended after this week’s open; and taking a Fibonacci retracement around this most recent bearish move shows the 50% marker at 124.62. This can open the door to short-side swings with stops above 124.78 or 125.00, with targets cast towards 123.75 and then a re-test of prior lows at 123.22.
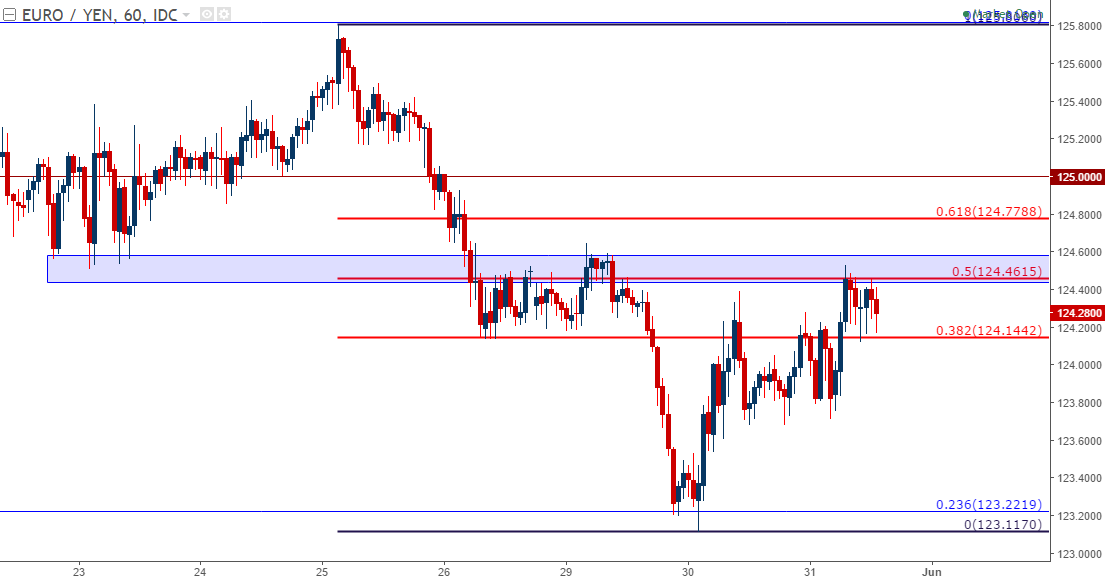
Chart prepared by James Stanley
--- Written by James Stanley, Strategist for DailyFX.com
To receive James Stanley’s analysis directly via email, please SIGN UP HERE
Contact and follow James on Twitter: @JStanleyFX


