


To receive James Stanley’s Analysis directly via email, please sign up here.
Talking Points:
- EUR/JPY Technical Strategy: Bullish, retracing after ECB extended QE.
- EUR/JPY ran up to a fresh 7-month high, catching resistance at a long-term Fibonacci level of 123.09.
- If you’re looking for trading ideas, check out our Trading Guides.
In our last article, we looked at the burgeoning uptrend in EUR/JPY with a watchful eye on the major psychological level around 120.00. And less than 10 pips below that 120-level we have a long-term Fibonacci level as 61.8% of the major move spanning the low from the year 2000 to the high set in 2008.
We had discussed the importance of this level two weeks ago, positing that should price action finally break back-above 120, traders could move forward with a bullish bias, looking to buy higher-low support once the trend finally saw some element of pullback or retracement. This morning’s European Central Bank announcement may have finally started this pullback, and with prices heading-lower, traders can now begin to plot for that next level of ‘higher-low’ support.
With 120 being such an obvious level, this could be an ideal place to look for some element of support around this zone in the effort of using ‘old resistance as new support’. For traders looking to plot top-side entries off of support at 120.00, the prior swing-low at 118.50 could be an attractive area to investigate for risk levels, with stops being lodged below this prior zone of support.
For traders looking to be a bit more aggressive with the bullish move, a prior swing-low at 120.85 may help provide some element of near-term support. Top-side entries here could be coupled with a stop below that confluent 120.00 level.
On the resistance side of EUR/JPY, at 121.95 we have the 50% retracement of the ‘Abe-nomics’ move in EUR/JPY, taking the 2012 low up to the 2015 high; at 123.09 we have the 38.2% retracement of the major move of the 2008 high down to the 2012 low; and at 125.00 we have a major psychological level in EUR/JPY that has historically been an important level for the pair. Each of these can function as targets for top-side continuation approaches.
The prior swing-low at 118.50 could be looked at as a form of invalidation of recent bullish momentum. Traders plotting long positions would likely want to question the veracity of the trend should this swing-low get taken-out.
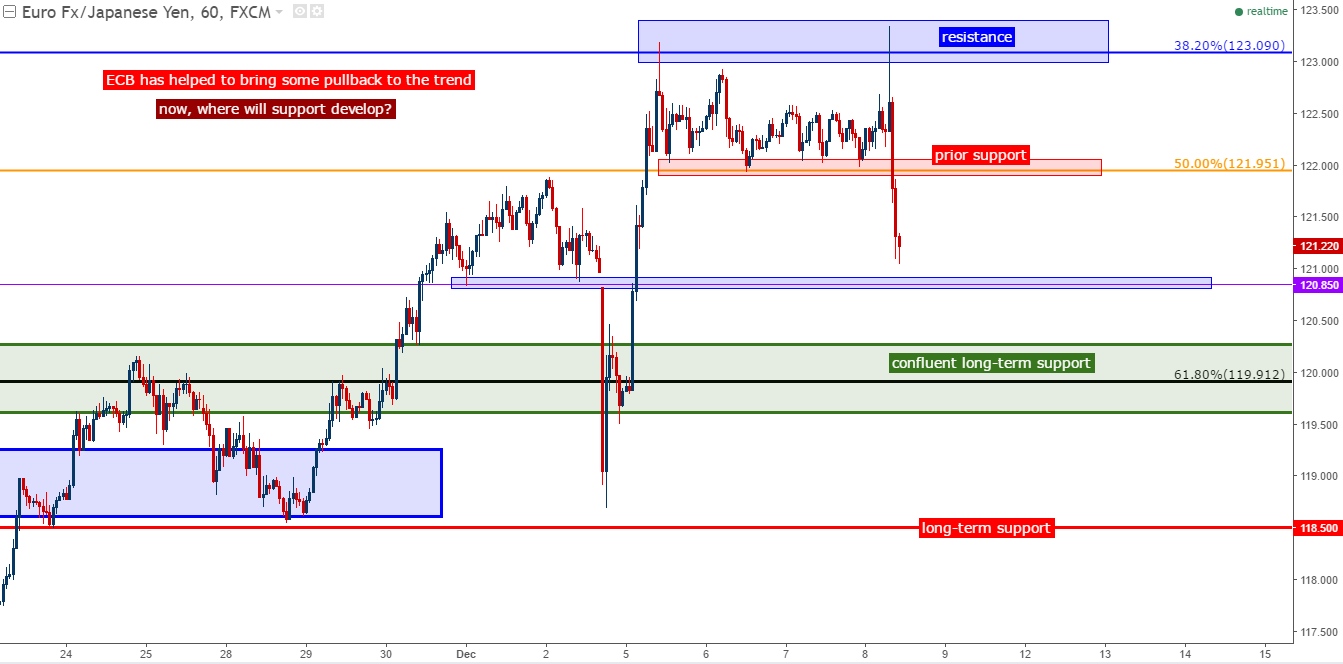
Chart prepared by James Stanley
--- Written by James Stanley, Analyst for DailyFX.com
To receive James Stanley’s analysis directly via email, please SIGN UP HERE
Contact and follow James on Twitter: @JStanleyFX


