


EUR/GBP Technical Analysis
EUR/GBP Price – Multi-Week High
On Friday, EUR/GBP rallied to a nine-week high at 0.9054 then retreated and settled below the 0.9000 handle as some bulls seemed to cut back. Nonetheless, the weekly candlestick closed in the green with a near 2.0% gain.
Alongside that, the Relative Strength Index (RSI) remained flat highlighting a paused bullish momentum.
EUR/GBP DAILY PRICE CHART (Aug 1, 2018 – June 3, 2020) Zoomed Out


EUR/GBP DAILY PRICE CHART (March 17 – June 3, 2020) Zoomed In
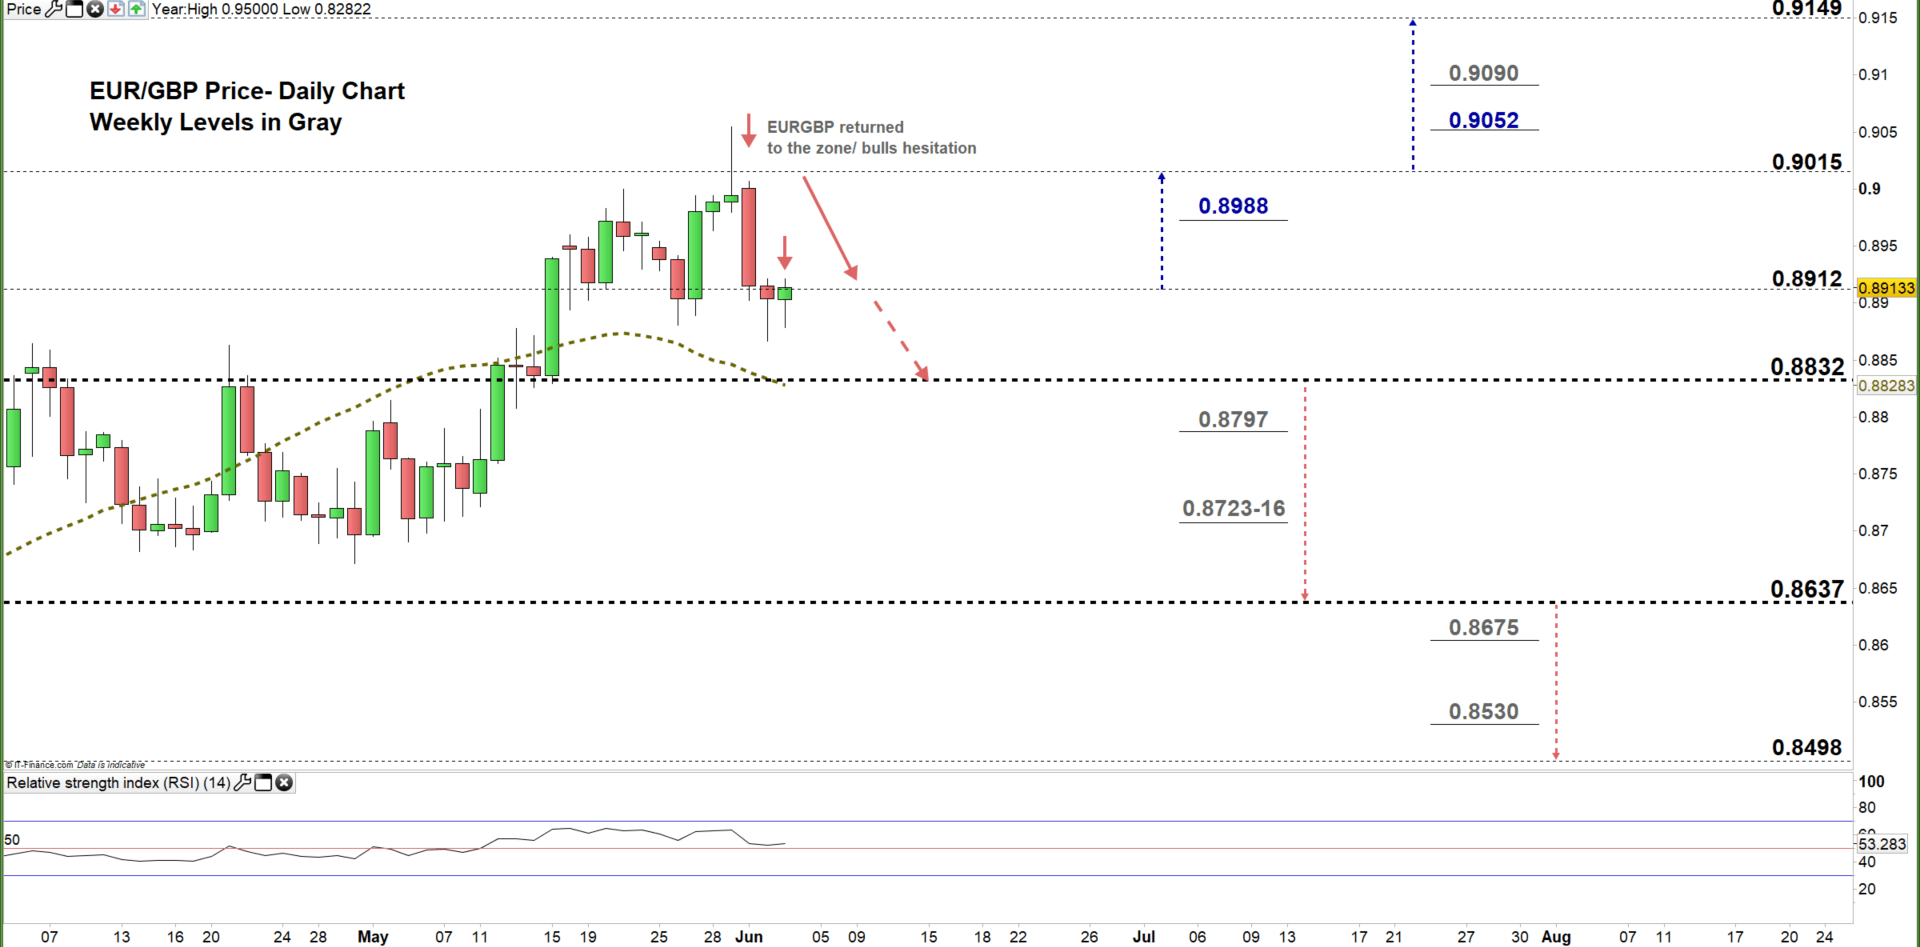
Last week, EUR/GBP failed to move to the higher trading zone reflecting bull’s hesitation. This week, the price fell to a lower zone 0.8832 – 0.8912 and signaled a weaker bullish sentiment.
A close below the low end of the aforementioned trading zone may encourage market participants to press towards 0.8637 and a further close below that level could send EURGBP even lower towards 0.8498.
In turn, a close above the high end of the zone cancels the last bearish signal and could trigger a rally towards 0.9015. A further close above that level may extend the rally towards 0.9149.
That said, the weekly support and resistance levels underlined on the daily chart (zoomed in) should be considered in both bullish/ bearish scenarios.

EUR/GBP FOUR HOUR PRICE CHART (MAy 13 – June 3, 2020)

On Tuesday, EURGBP broke below the middle line on the uptrend lines fan originated from the May 14 low at 0.8826. The price failed on multiple occasions to overtake this line highlighting a possible start of a bearish momentum. Thus, any violation of the lower line on the fan would generate an additional bearish signal.
A break below 0.8826 could send EURGBP towards 0.8745. In turn, any break in the other direction i.e. above 0.8939 may trigger a rally towards 0.9015. Although, the daily support and resistance marked on the four-hour chart should be kept in focus.

Written By: Mahmoud Alkudsi, Market Analyst
Please feel free to contact me on Twitter: @Malkudsi


