


EUR/GBP Technical Analysis
EUR/GBP – Multi Month High
Last week, EUR/GBP printed 0.8641- its highest level in over three and half months. The price declined after as some bulls seemed to cut back. Yet, the weekly candlestick closed in the green with 2.7% gain.
This week, the Relative Strength Index (RSI) has abandoned overbought territory highlighting a weaker uptrend move.
EUR/GBP Daily PRice CHART (Jun 1, 2018 – Mar 6, 2020) Zoomed Out
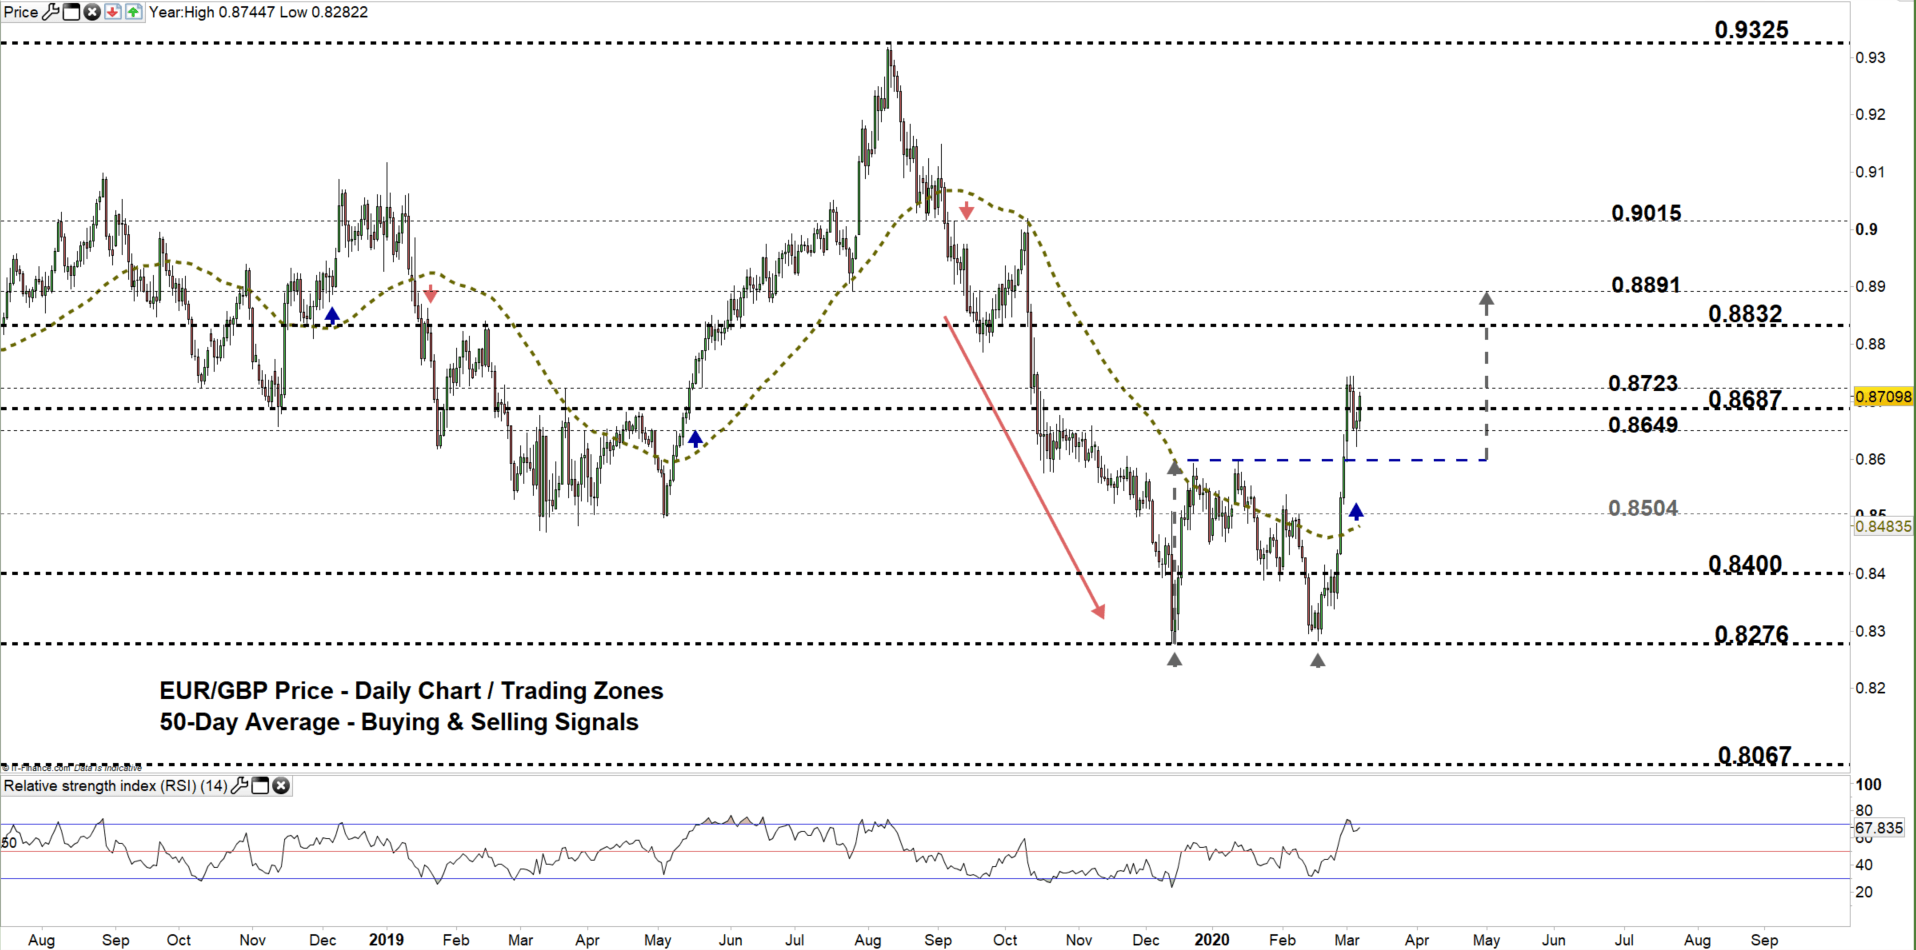

EUR/GBP DAILY PRICE CHART (SEP 4 – Mar 6, 2020) ZOOMED IN

Looking at the daily chart, we noticed that on Feb 27 EUR/GBP rallied then closed above the 50-day average generating a bullish signal. In the following day, the pair broke above the neckline of double bottom pattern discussed in our last week update at 0.8596.
This week, the market has opened with a breakaway gap to the upside providing another bullish signal. Later, the price declined yet remained in the current trading zone 0.8649 – 0.8687. Thus, a close above the high end of the zone may cause a rally towards 0.8723. Further close above that level could mean more bullishness towards 0.8832. In that scenario, the weekly resistance levels underlined on the chart (zoomed in) should be considered.
On the flip side, any close below the low end of the zone could mean bull’s hesitation. This could lead some of them to exit the market allowing the price to fall towards 0.8504. Further close below that level could send EURGBP even lower towards 0.8400 handle. That said, the daily and weekly support levels marked on the chart should be kept in focus.

EUR/GBP FOUR HOUR PRICE CHART (JAn 15- Mar 6, 2020)

From the four- hour chart, we noticed that on Wednesday, EUR/GBP broke below the neckline of double top pattern residing at 0.8681, then fell to 0.8620. Currently, the price trades above the uptrend line originated from the Feb 28 low at 0.8521. Any violation to this line would be considered a bearish signal.
Thus, a break below 0.8589 could send EURGBP towards 0.8504. Nevertheless, the daily support level underscored on the chart would be worth monitoring. On the other hand, a break above 0.8746 could resume bullish price action towards 0.8808. Although, the weekly resistance level printed on the chart should be watched closely.
See the chart to figure out more about key technical levels the price would encounter in a further bullish/ bearish scenario.

Written By: Mahmoud Alkudsi
Please feel free to contact me on Twitter: @Malkudsi


