


EUR/GBP Technical Outlook
EUR/GBP – Bears Ease Up
Last week, Euro tested its lowest level against in over two months against British pound and printed 0.8282. However, the market rallied after as some bears seemed to cover and as a result, the price closed the weekly candlestick with 0.8% gain.
This week, the Relative Strength Index (RSI) crossed above 50 signaling the end of downtrend move.
EUR/GBP Daily PRice CHART (Jun 1, 2018 – Feb 28, 2019) Zoomed Out
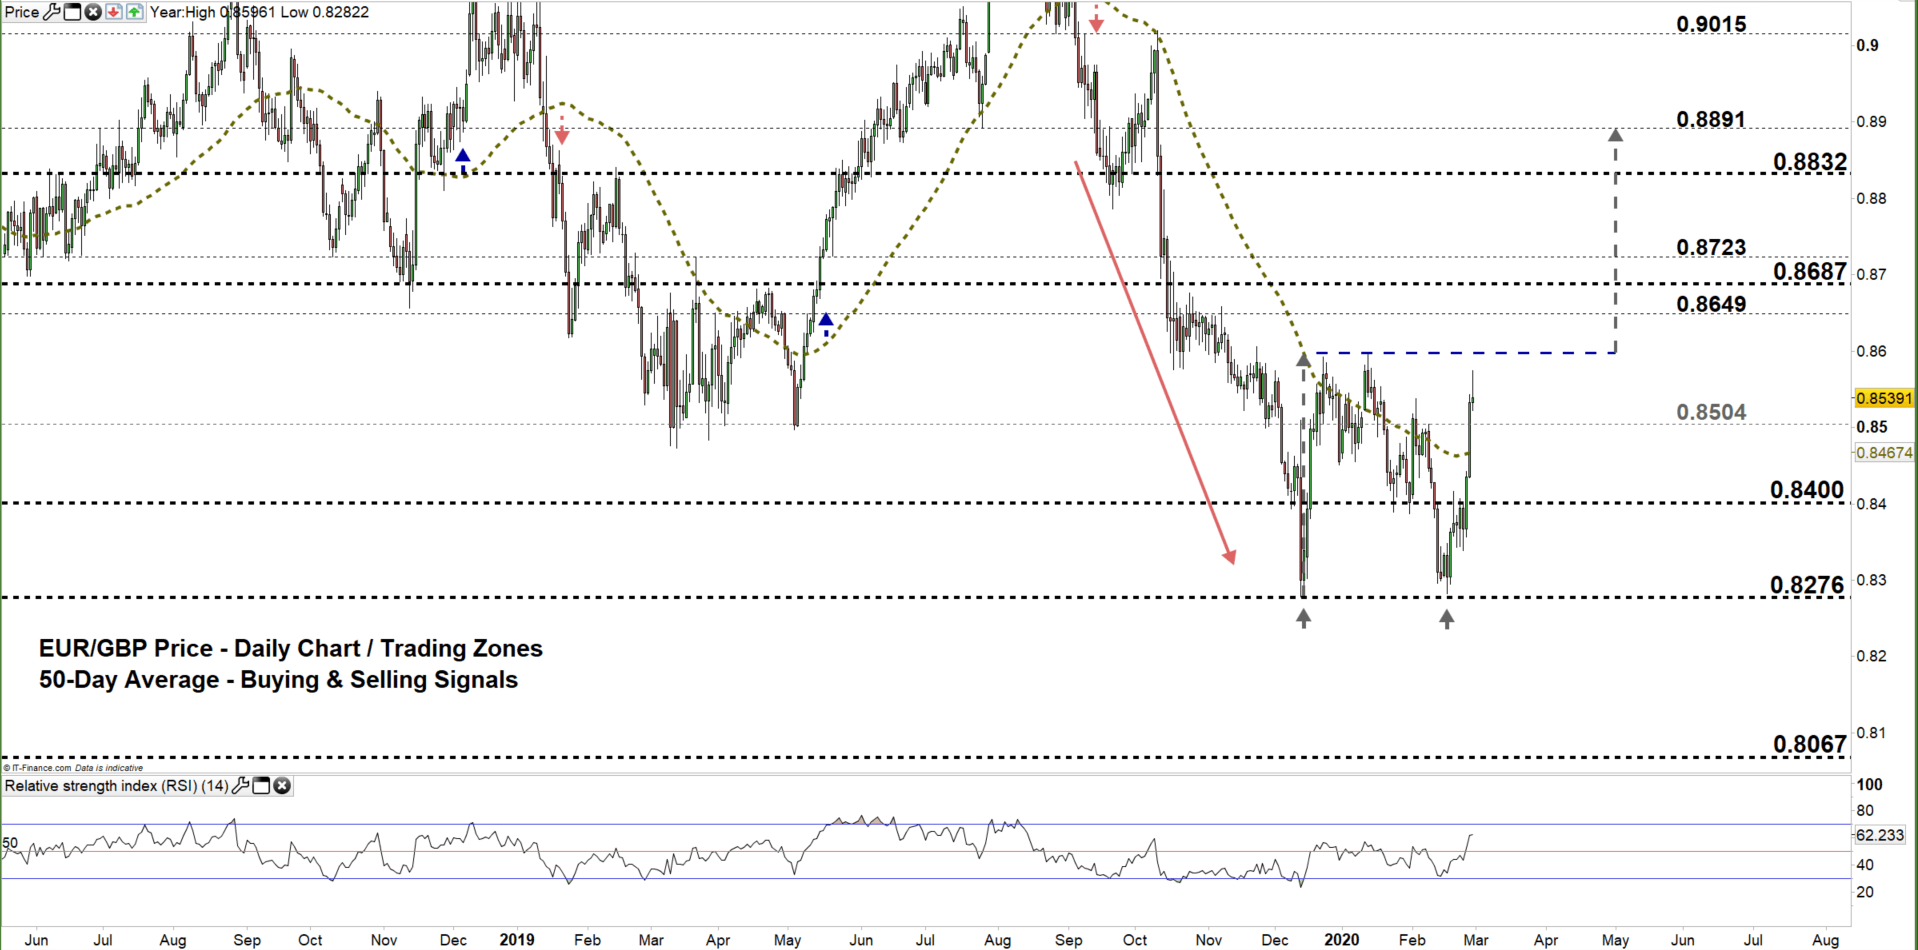
EUR/GBP DAILY PRICE CHART (SEP 4 – FEB 21, 2019) ZOOMED IN

Looking at the daily chart, we notice that on Wednesday, bears showed more sway allowing the pair rally further. Yesterday, the price moved to a higher trading zone 0.8504 – 0.8649.
A close above the high end of the zone could push EUR/GBP towards 0.8687. Further close above 0.8723 opens the door for bulls to lead the market towards 0.8832. Having said that, the weekly resistance levels underlined on the chart (zoomed in) should be watched closely.
Its worth noting that, if the price breaks and remains above the neckline of double top pattern residing at 0.8596, this could send EURGBP towards 0.8891. Special attention should be paid to the trading zones marked on the chart as some traders might exit/join the market around these points.
On the flip-side, any close below the low end of the zone could generate a comeback signal for bears, and may encourage them to press EURGBP towards 0.8400 handle. Further close below that level could send the price even lower towards 0.8276. In that scenario, the daily support levels and area printed on the chart would be worth monitoring.
EUR/GBP FOUR HOUR PRICE CHART (JAn 15- FEB 28, 2020)

From the four- hour chart, we noticed that yesterday EUR/GBP broke above the downtrend line originated from the Jan 14 high at 0.8596, eyeing a test of 0.8687.
Thus, a break above 0.8632 could cause a rally towards 0.8669. Although, the high end of current trading zone discussed on the daily chart should be considered. On the other hand, a break below 0.8490 could send EURGBP towards 0.8422. Yet, the daily support level marked on the chart should be kept in focus.
See the chart to figure out more about key technical levels the price would encounter in a further bullish/ bearish scenario.
Written By: Mahmoud Alkudsi
Please feel free to contact me on Twitter: @Malkudsi


