EUR/GBP Technical Analysis
- EUR/GBP uptrend testing next critical psychological barrier
- 4-hour chart reveals early warning sign of a bearish reversal
- EP Elections, Brexit deal to be key fundamental drivers next
Just started trading EUR/GBP? Check out our beginners’ FX markets guide !
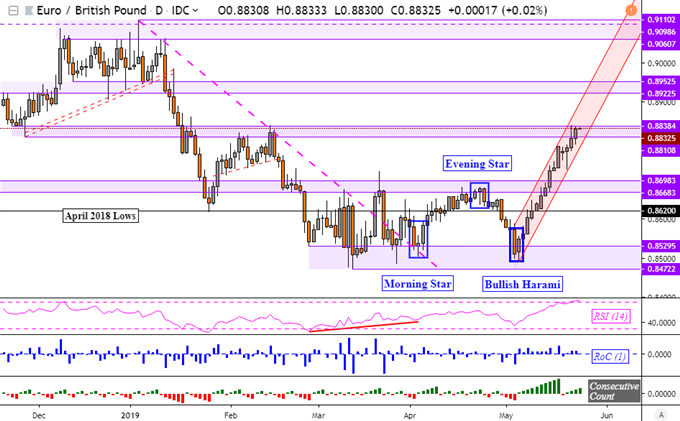
Following the emergence of a Bullish Harami candlestick pattern, the Euro launched an impressive rally against the British Pound with EUR/GBP rising about 3.75% over the course of almost three weeks. Along its path, it encountered a bearish reversal warning which was overturned with relative ease. Fundamentally, broad weakness in Sterling was as a consequence of heightened uncertainty over a Brexit deal.
This leaves EUR/GBP facing the next critical psychological barrier after it ascended into a range between 0.8811 and 0.8838 in its rising channel from early May. This area initially acted as support back in November before re-establishing itself as resistance in February. If broken, this would open the door to extending the dominant uptrend, placing the next area of resistance between 0.8923 and 0.8953.
EUR/GBP Daily Chart

Chart Created in TradingView
EUR/GBP Upside Momentum Tested
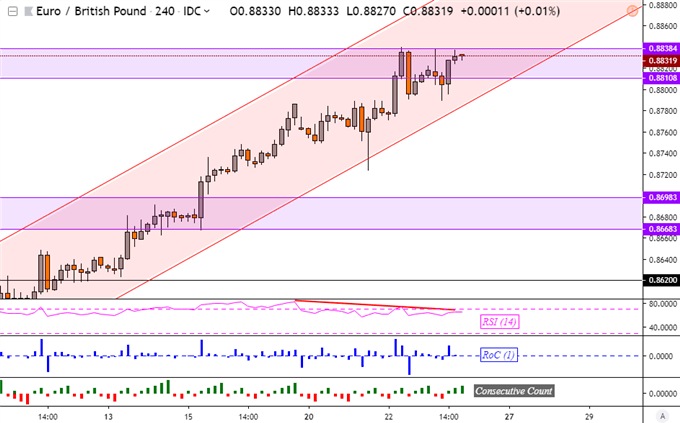
Zooming in on the EUR/GBP 4-hour chart to get a better look at how it may behave at resistance shows a sign of caution. Negative RSI divergence has accompanied the pair’s ascent into key resistance. This shows fading upside momentum and with confirmation, via further closes to the downside, this may precede a turn lower in the medium-term. As such, we may get a test of the floor of the rising channel just under 0.8811.
If there is a major turnaround to come and the rising channel falls apart, the pair may eventually make its way back to the former psychological barrier between 0.8698 and 0.8668. Fundamentally, the Euro could succumb to selling pressure if more eurosceptic parties gain seats from the European Parliamentary Elections. But, this will have to compete with the future of Brexit negotiations.
EUR/GBP 4-Hour Chart

Chart Created in TradingView
FX Trading Resources
- Just getting started? See our beginners’ guide for FX traders
- See our free guide to learn what are the long-term forces Euro prices
- See how the British Pound and Euro are viewed by the trading community at the DailyFX Sentiment Page
--- Written by Daniel Dubrovsky, Junior Currency Analyst for DailyFX.com
To contact Daniel, use the comments section below or @ddubrovskyFX on Twitter


