


EUR/GBP Talking Points:
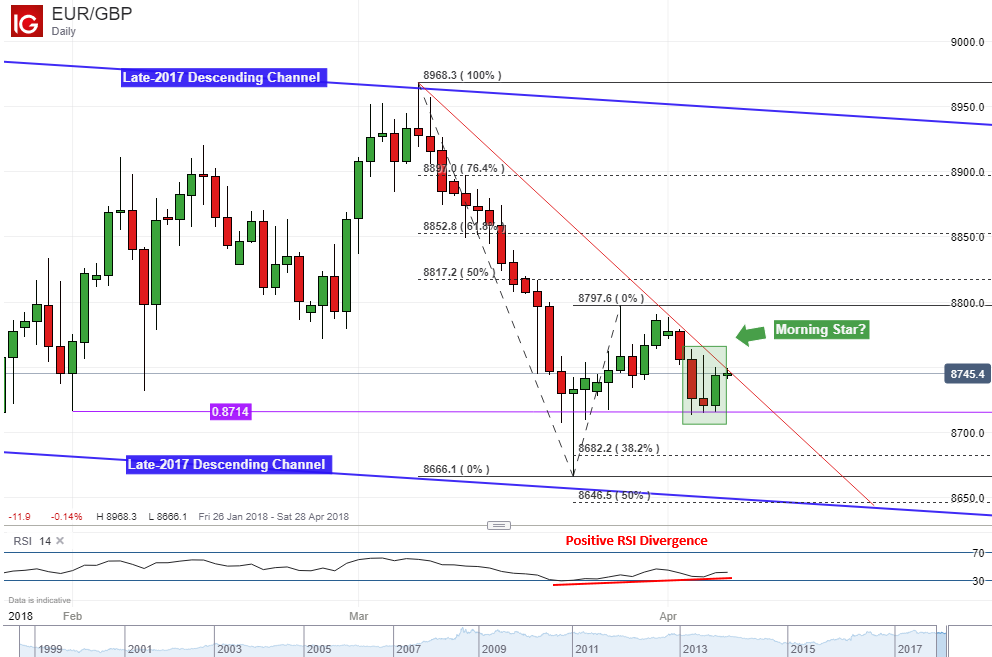
- Is EUR/GBP getting ready to turn higher within a descending channel from 2017?
- A bullish reversal pattern and positive RSI divergence warn that prices may climb
- Near-term resistance is a falling line from early March, support stands at 0.8714
Build confidence in your own EUR/GBP strategy with the help of our free guide!
The Euro might be getting ready to make a more lasting move higher against its British counterpart within a descending channel from late-2017. On the chart below, a morning star candlestick bullish reversal pattern has formed right below a short-term falling line from early March. Even so, confirmation via a close above immediate resistance will be needed to argue that EUR/GBP is turning higher.
Simultaneously, positive RSI divergence has accompanied the pair’s descent as of late and signals that downside momentum is slowly decreasing. This could be used as another argument that prices may indeed reverse higher soon.
From here, a push above the short-term line exposes the March 27th high at 0.8797. The next target would be the 50% midpoint of the Fibonacci retracement at 0.8817. Following that is the 61.8% level at 0.8852.
On the other hand, if prices keep pushing lower, immediate support is the February 1st low at 0.8714. This horizontal area caught EUR/GBP as it fell in March and kept it up on multiple occasions. If prices manage to break through, the next target will be the 38.2% Fibonacci extension at 0.86682. A push below that exposes the March 22nd low at 0.8666 and then the lower line of the descending channel.
EUR/GBP Trading Resources:
- Join a free Q&A webinar and have your trading questions answered
- Just getting started? See our beginners’ guide for FX traders
--- Written by Daniel Dubrovsky, Junior Currency Analyst for DailyFX.com
To contact Daniel, use the comments section below or @ddubrovskyFX on Twitter
To receive Daniel's analysis directly via email, please SIGN UP HERE


