Copper price, news and analysis:
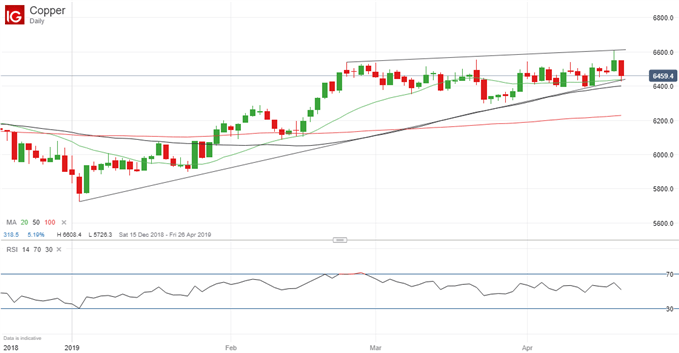
- The copper price is looking technically weak, challenging support from a trendline joining the higher lows in place since early 2019.
- That could reflect concern that the global economy is still showing few signs yet of a sturdy recovery.
Copper challenges trendline support
The price of copper is in danger of breaking lower as it challenges support from a trendline in place since the start of this year. As the chart below shows, it is currently sitting on both that trendline and the 20-day moving average, with the 50-day moving average just below.
Those supports could prevent a downturn near-term, but if they are breached the copper price could fall swiftly to the lows around $6,300/tonne recorded between March 22 and March 25.
Copper Price Chart, Daily Timeframe (December 17, 2018 – April 18, 2019)

Chart by IG (You can click on it for a larger image)
The price of copper, which is used widely in manufacturing, tends to move with global economic sentiment, and that is on a knife-edge at present. Data from China earlier this week was seen as broadly positive but Thursday’s Purchasing Managers’ indexes from Europe and elsewhere suggested that any global recovery is patchy at best, potentially raising questions about future demand for the metal.
You can find out how to trade copper here
And here’s where to find out more about the metal
Further resources to help you trade the markets:
Whether you are a new or an experienced trader, at DailyFX we have many resources to help you:
- Analytical and educational webinars hosted several times per day,
- Trading guides to help you improve your trading performance,
- A guide specifically for those who are new to forex,
- And you can learn how to trade like an expert by reading our guide to the Traits of Successful Traders.
--- Written by Martin Essex, Analyst and Editor
Feel free to contact me via the comments section below, via email at martin.essex@ig.com or on Twitter @MartinSEssex


