


ASX 200 Technical Analysis Talking Points:
- The index looks a little stretched
- Bulls have not managed to nail down their recent progress
- A major reversal seems unlikely for as long as trade hopes underpin risk appetite
Find out what retail foreign exchange traders make of the Australian Dollar’s chances right now at the DailyFX Sentiment Page.
The ASX 200 has nosed back into what still looks like an important resistance zone, but whether it can now stay there looks like the big question for this market.
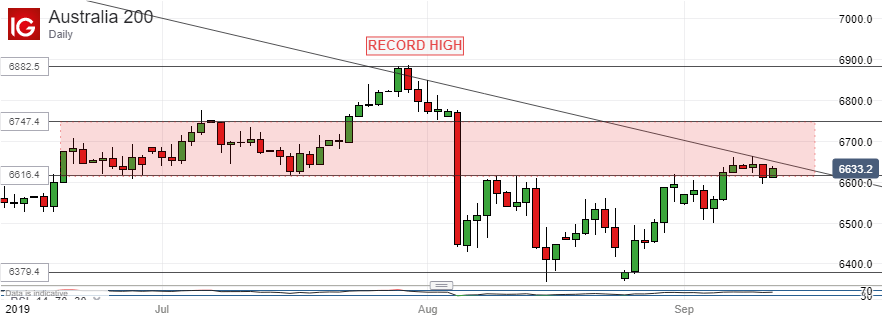
The zone itself is in red on the chart above and encompasses a trading range which held the market between June 19 and July 23 and provided the base for late July’s short-lived jump up to record highs.
The Sydney stock benchmark got back within it late last week but, as you can see from the chart, hardly in very convincing style. There’s already been one intraday foray back below the range base.
The bulls’ first task must be to challenge the incipient downtrend which seems to be forming on the chart. To get that done they’ll need to get the index above as far above 6652.6 as they can. Should they be able to hold that altitude then they can perhaps attend to taking back more of the nasty, one-day fall seen on August 5.
Retracing all of it would probably be a powerful near-term psychological symbol but it doesn’t look very likely in the near term. There is a lot of work to do before any such attempt can be made.
Falls will probably find support at the previous significant low. That’s September 4’s 6501.9 That in turn guards the way to 6359.1, the low of August 25.
The chart clearly suggests that the index lacks a bit of momentum and it would be no surprise to see another fall below that range base. However, fundamentally speaking, the ASX looks most unlikely to fall very far for as long as hope remains for a lasting truce in the US-China trade war. The two sides are still on course to meet next month, and more emollient comments have been heard from both
ASX 200 Resources for Traders
Whether you’re new to trading or an old hand DailyFX has plenty of resources to help you. There’s our trading sentiment indicator which shows you live how IG clients are positioned right now. We also hold educational and analytical webinars and offer trading guides, with one specifically aimed at those new to foreign exchange markets. There’s also a Bitcoin guide. Be sure to make the most of them all. They were written by our seasoned trading experts and they’re all free.
--- Written by David Cottle, DailyFX Research
Follow David on Twitter @DavidCottleFX or use the Comments section below to get in touch!


