


ASX 200 Technical Analysis Talking Points:
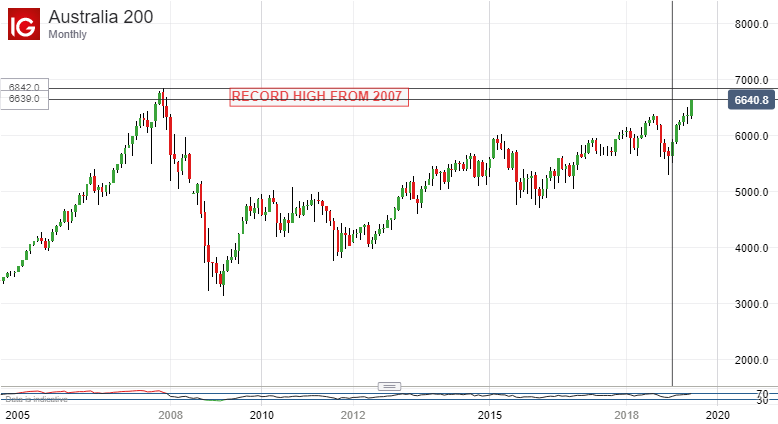
- The ASX is close to its 2007 high point
- Its nearer term uptrend channel faces a topside test
- Some consolidation is likely, but not a major reversal
Find out what retail foreign exchange traders make of the Australian Dollar’s chances right now at the DailyFX Sentiment Page.
The ASX 200 came through this year’s very patchy risk appetite in style and is now back within close distance of its own record peaks.
The latest boost has come from suspicions that the European Central Bank could soon bolster the global atmosphere of looser monetary policy, and from hopes that the leaders of China and the US will find constructive things to say to each other on trade at this months’ Group of 20 get-together in Osaka.
So much for the fundamentals. The ASX is closing in on a resistance zone which guards those 2007 peaks. Moreover, a look at the monthly chart reveals that the entrenched uptrend from 2009’s post crisis low remains at least as strong as ever.
Meanwhile the daily chart shows that the benchmark is attempting to break above the strong uptrend which has previously contained trade since February 4. It hasn’t managed to do so yet on a daily closing basis. but if risk appetite holds up it almost certainly will.
Of course with no real sign of any serious letup in the bull trend the only real immediate question is where any exhaustion-inspired setbacks may find support.
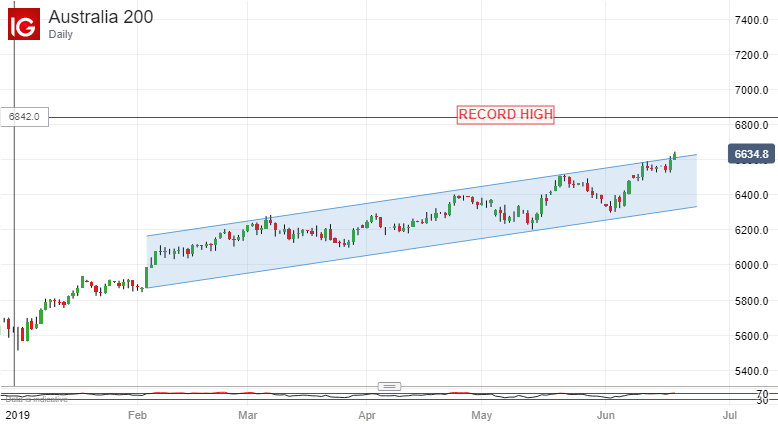
Once broken conclusively the channel top may offer some, but possibly not enough to halt any likely retracement.
The first 23.6% Fibonacci retracement of the rise from Februay 4 may offer some. It comes in well below the current market at 6462.2. Perhaps significantly that is also close to where the ASXC made its last significant peak in the last week of May.
It’s probably worth pointing out that a return to this level without a conclusive break of the uptrend channel would look quite bearish in the short term, and on that basis probably isn’t likely.
However the index is looking unsurprisingly overbought at current levels so some consolidation is both probable and necessary in the sessions ahead, even if it probably won’t signal any significant reversal.
Resources for Traders
Whether you’re new to trading or an old hand DailyFX has plenty of resources to help you. There’s our trading sentiment indicator which shows you live how IG clients are positioned right now. We also hold educational and analytical webinars and offer trading guides, with one specifically aimed at those new to foreign exchange markets. There’s also a Bitcoin guide. Be sure to make the most of them all. They were written by our seasoned trading experts and they’re all free.
--- Written by David Cottle, DailyFX Research
Follow David on Twitter @DavidCottleFX or use the Comments section below to get in touch!


