


ASX 200 Technical Analysis Talking Points:
- The ASX has edged back into a long-term uptrend channel
- However the bulls have plenty of work to do
- The last key high remains elusive and will have to be recaptured
Get live, interactive coverage of all major Australian economic data at the DailyFX Webinars
The ASX 200 remains within the short uptrend that has been in place since late October.
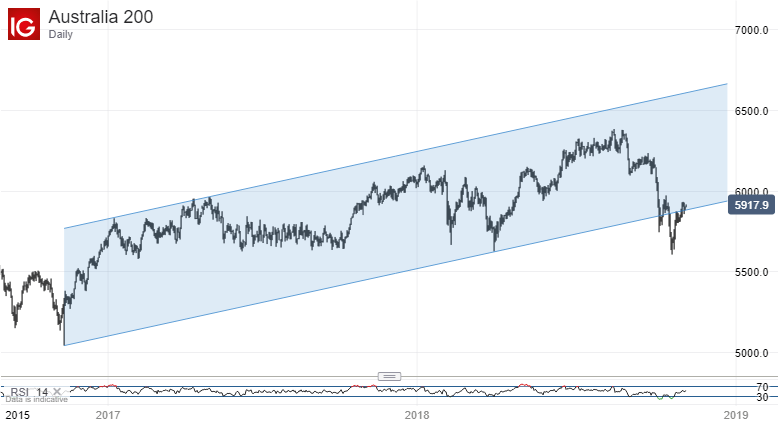
However, this break higher has not yet managed to put the Sydney stock benchmark conclusively back into the broader, daily chart which had previously held strong since late 2016, only to give way in September of this year.
The next few sessions could therefore be most interesting from the point of view of likely direction into year-end. The bulls’ first order of business must be to top the previous, short-term significant peak. That comes in at 5972.7, the intraday peak of October 19. It is not far above current market levels but it remains elusive on a daily closing basis and the bulls need to recapture it.
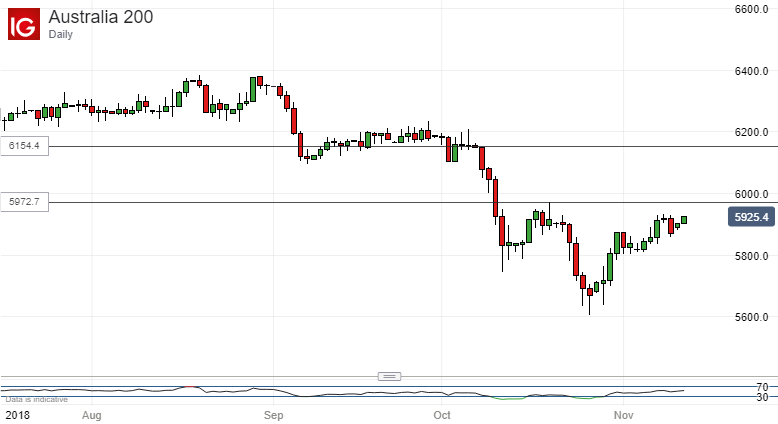
We might note that, even if they can get there, they will still have plenty to do if they are to overcome completely the sharp series of daily falls that took the index down between October 9 and 11. Doing that will be the bulls’ second order of business but that first, 5972.7 level will be at least an informative gauge of their resolve.
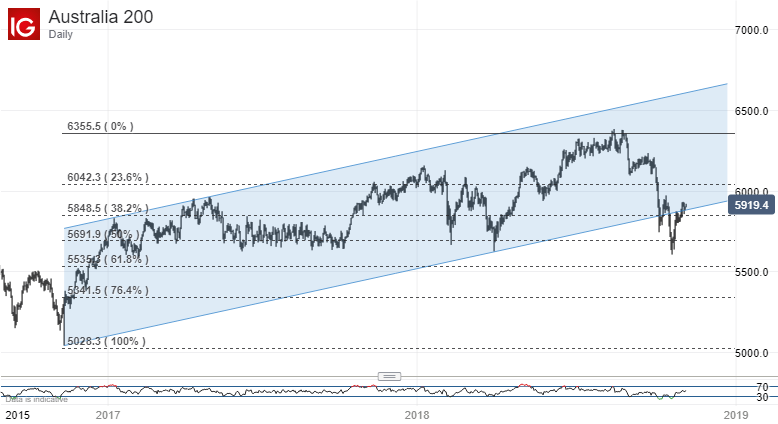
On a broader basis, the index appears to be stuck between the first, 23.6% Fibonacci retracement of the rise up from late 2016’s lows to the peaks of October this year at 6042.3 and the third, 50% retracement at 5691.9.
For the moment, it is hovering around the mid-level, 5858.5, and the fate of that may well determine near-term direction. It is holding, but the market is only about 70 points above it. The best plans this week may be to keep playing that newish uptrend channel, with any break deemed a reasonable directional clue.
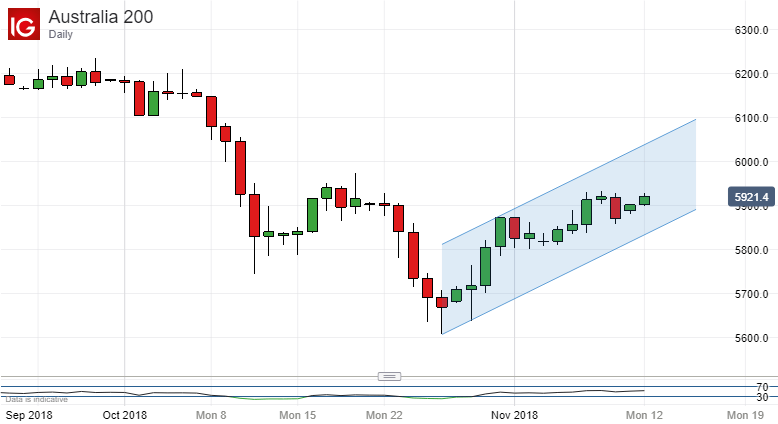
It will be interesting to see whether the uptrend can endure until it retakes that late October high.
Resources for Traders
Whether you’re new to trading or an old hand DailyFX has plenty of resources to help you. There’s our trading sentiment indicator which shows you live how IG clients are positioned right now. We also hold educational and analytical webinars and offer trading guides, with one specifically aimed at those new to foreign exchange markets. There’s also a Bitcoin guide. Be sure to make the most of them all. They were written by our seasoned trading experts and they’re all free.
--- Written by David Cottle, DailyFX Research
Follow David on Twitter @DavidCottleFX or use the Comments section below to get in touch!


