Talking Points - ASX 200, Risk Trends, 3Q Chinese GDP
- ASX 200 gains likely to reverse amidst broader downward trend
- Prices are currently testing February-March 2015 resistance levels
- Risk trends and China GDP in focus for next steps
Find out what the #1 mistake that traders make is and how you can fix it!
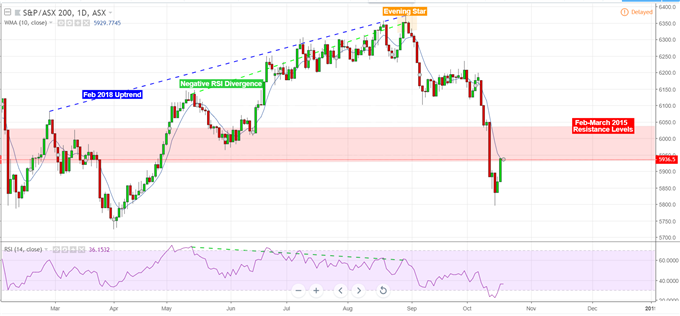
The ASX 200 may soon resume downside momentum, possibly reversing recent gains on developments in the financials and materials sector. Recently, the index succumbed to market-wide risk aversion and extended a decline which started at the end of August, causing it to tumble from an 11-year high of 6373.5 and shed nearly 600 points. The dip was preceded by an Evening Star bearish reversal pattern and confirmed prior negative RSI divergence. The break in trend line support has brought the equity index to levels last seen in April 2018, erasing a six-month rally.
ASX 200 prices are currently eyeing near-term resistance, testing a range last seen from February to March 2015 in the 5920-6050 area. A break through these levels confirmed on a daily closing basis could provide the foundation for a bullish set-up, although the absence of clear-cut bullish reversal signals, such as Engulfing or Morning Star patterns, calls for caution. Furthermore, the Australian stock benchmark’s fall has dipped below the 10-day weighted moving average, suggesting further bearish pressure.
ASX 200 Chart (Daily)

Find out what retail traders’ buy and sell decisions say about the coming price trend!
Currently, an actionable ASX 200 trade set up seems to be lacking. Due to the possibility of further bullish cues given the stock benchmark’s slight rally, entering a short trade is unattractive. Looking ahead, traders should closely eye risk trends, as well as Chinese economic data. Declines from European and American equities may echo into Asia Pacific stock benchmarks, as global risk appetite unravels. In addition, slowing Chinese economic growth could point to a bearish reversal for the ASX 200.
ASX 200 Trading Resources
- Join a free Q&A webinar and have your trading questions answered
- Having trouble with your strategy? Here’s the #1 mistake that traders make
- See our global equities forecast to learn what will drive prices through year-end
--- Written by Megha Torpunuri, DailyFX Research Team


