


ASX 200 Technical Analysis Talking Points:
- The Australian stock benchmark has yet to make back its sharp falls of late August
- Key support has kept the bears in check since
- But they may be gearing up for another try at it
Get live, interactive coverage of all major Australian economic data at the DailyFX Webinars
The ASX 200 has yet to make up the sharp falls from ten-year highs which dogged it in early September.
However, bulls can perhaps take heart from the fact that key support has so far held, and that the index remains really quite close to those peaks.
The ASX was thus stuck in a broad range for most of September, unable to reclaim its highs but unwilling to go much lower either. That trend has continued into October and will endure for as long as 6203.6 limits the upside on a daily closing basis and 6152.6 restrains the bears.
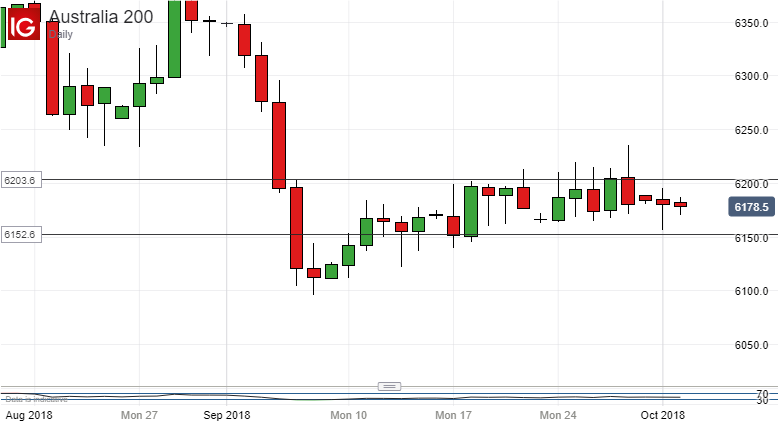
Within that range, there have been plenty of days in which the daily range has dwarfed the smaller gap between the open and the close. These are usually suggestive of a degree of indecision in the market. This indecision I think remains and it may be best to play that range simply for now, but with a close watch on its base.
While momentum indicators are not giving a lot away, the ASX’s 20-day moving average has crossed below its 100- and 50-day counterparts. This sort of crossover can be suggestive of some bear pressure. Moreover and more obviously for as long as the bulls are unable to make meaningful progress back towards those highs, the more their willingness to try will be called into question.
Should the range give way, support to watch closely would lie at 6091.9. That represents 38.2% Fibonacci retracement of the climb up from the lows of April to those ten-year peaks of August. It is also where the last bear foray was halted back in early September, probably not coincidentally.

For as long as it holds, so can the thesis that recent range trade may yet be simply a process of base-building from which the bulls can again gain control.
If it breaks then I think that idea is just about done for and focus will be more squarely on the downside and the lower retracement levels.
Resources for Traders
Whether you’re new to trading or an old hand DailyFX has plenty of resources to help you. There’s our trading sentiment indicator which shows you live how IG clients are positioned right now. We also hold educational and analytical webinars and offer trading guides, with one specifically aimed at those new to foreign exchange markets. There’s also a Bitcoin guide. Be sure to make the most of them all. They were written by our seasoned trading experts and they’re all free.
--- Written by David Cottle, DailyFX Research
Follow David on Twitter @DavidCottleFX or use the Comments section below to get in touch!


