


Talking Points:
- The ASX 200 was knocked hard in early February
- It wasn’t alone in that of course, but the global stock selloff has pushed the Aussie index under 6000
- Bulls will need resolve to retake that totemic level
Is there really a secret ingredient? What makes some traders stand out from the rest? Check out DailyFX’s deep, deep dive into the Traits of Successful Traders
The ASX 200 has staged a little rally from lows made earlier this month which came in turn on a vicious global stock selloff rather than on any worries specific to its home nation.
The index had slipped to the high-5,700 region by February 9, when it had looked comfortable above the psychologically crucial 6,000 mark just four days before that. It then bounced just above 5764.9. That level represents the 76.4% Fibonacci retracement of the impressive climb from October 17’s lows to the ten-year highs made in January of 2018. However, the index remains well shy of those peaks. Can it reclaim them?
So far the jury is out but one or two omens don’t look that great, at least not if you’re in the bullish camp.
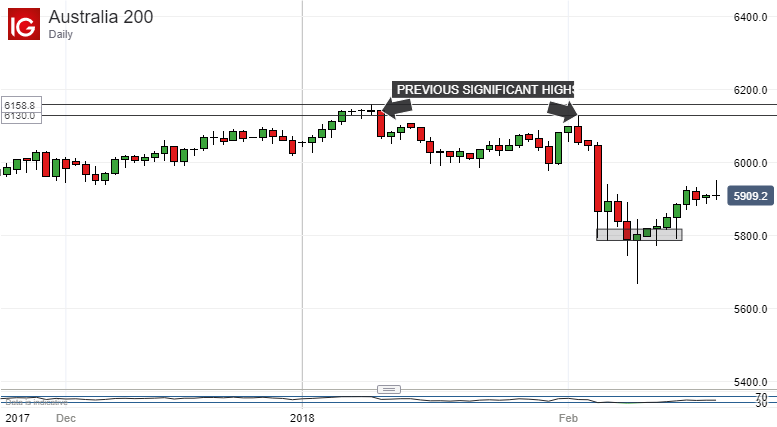
The index has certainly clawed back some ground from the lows made earlier this month, but it certainly has not retaken all of it. In addition, it looks unable to do so. Moreover, that 6000 level remains probably out of short-term reach at 100 points or so above the current market.
It’s worth at this point reminding ourselves why 6000 is such an important bellwether. The chart below shows just how little time the ASX has spent above that mark in the last ten years. There was a reasonable foray in 2007 and 2008 but, since then, the index has touched that level only briefly and retreated, twice. In short, it takes a brave investor to hang on at that height.
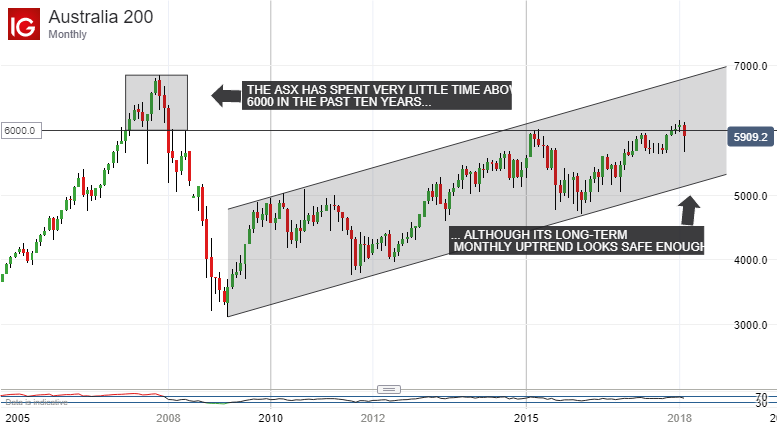
That said, a sense of perspective is important. The ASX is still very close to ten-year highs and its longer-term monthly uptrend channel from the post-crisis lows of March 2009 looks safe enough.
The shorter-term picture is gloomier though. The benchmark’s 20-day moving average has recently crossed below its 50- and 100-day counterparts. Such a crossover is not usually thought to be good news for bulls. Moreover, Monday’s trading session evinced some indecision. The index traded a moderately wide range during the day but it ended quite close to where proceedings started. This sort of candle formation suggests that investors are becoming more uncertain, although widespread global market holidays from China to the US may well have muted trade.
For now, direction may be best suggested by the uptrend channel which formed from February 8’s trading action.
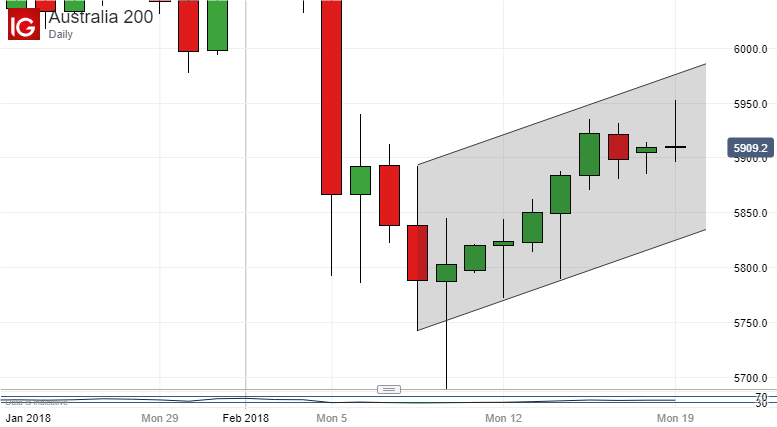
The lower, uptrend bound of that channel has been quite well respected and looks valid. As you can see, however, the rally appears to be petering out quite well short of the channel top. Keep an eye on this range as the week progresses. If the lower boundary remains in place, then there’s reason to hope that this recovery can go on.
--- Written by David Cottle, DailyFX Research
Follow David on Twitter: @DavidCottleFX or us the Comments section below to get in touch


