


ASX 200 Technical Notes:
- ASX 200 prices dropped more than 4.2 percent last week, largest decline since early 2016
- So far this week, the index has put in a recovery after forming a long-term rising trend line
- Weekly chart warns against assuming a reversal as key support levels block the way down
Find out what the #1 mistake that traders make is and how you can fix it!
The S&P/ASX 200 fell more than 4.2 percent last week, dropping from a high of 6,060 to close around 5,805 by Friday. Its decline coincided with a market-wide panic selloff that sent other indexes, such as the Nikkei 225, falling to an extent not seen in years. In fact, the last time the Australian market benchmark experienced a selloff of such magnitude was during the first week of 2016. That was more than two years ago.
A recovery has since ensued. The index is at a 10-day high as of Thursday’s close, with prices up as much as 4.5 percent from the February 9th low of 5,668. On that day, prices closed at the bottom of the range containing price action in mid-2017. In addition, that area of support also aligned with the 23.6% Fibonacci retracement (see daily chart below).
From here, a continuation of the bounce would place the 61.8% level at 5,972 as near-term resistance. A break above that would expose the 76.4% Fib at 6,044. On the other hand, if prices reverse lower again, the 38.2% level at 5,856 might stand as immediate support. A fall below that would expose the aforementioned area of support marked by the “range high” on the weekly chart below.
ASX 200 Daily and Weekly Charts: 2016 rising trend line has formed!
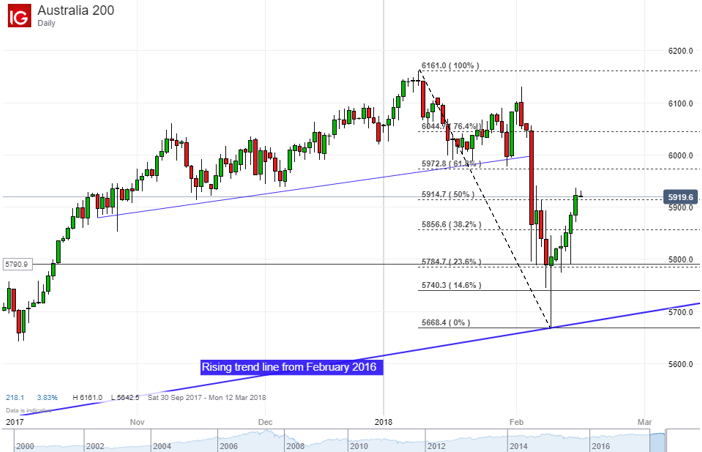
On the weekly chart, it is too early to say if the ASX 200 is turning lower in a lasting way. The bottom formed in the wake of last week’s selloff seems to have provided the third point in a long-term rising trend line dating back to February 2016. Even if the index resumes its decline in the coming days and weeks, sellers will now have the appearance of a formidable barrier to contend with.


