


Talking Points:
- Last week the ASX 200 stood at a crossroads
- A bearish double top formation was possible, but so was a much more bullish pennant
- Now it looks as though the latter prospect dominates
Trade all the major Asia Pacific economic data impacing the ASX 200 live and interactive at the DailyFX Webinars
When I last looked at the ASX 200’s charts a week ago they seemed to offer two possible futures.
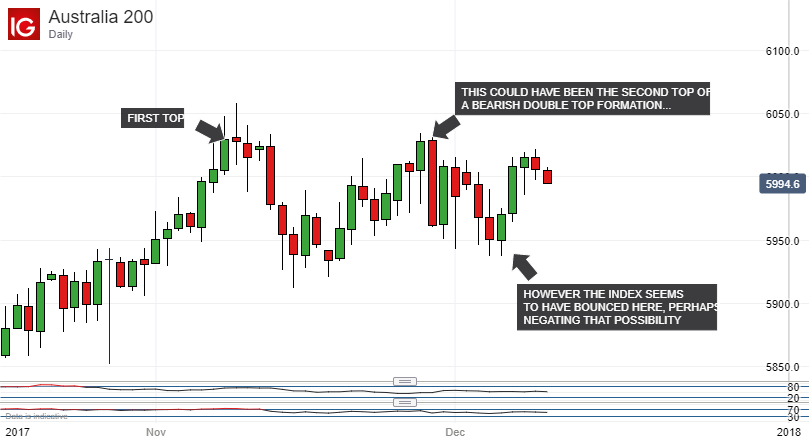
The trouble was that they were mutually exclusive. One prospect was that of a classic, bearish double top. In that scenario the index would have peaked again at the highs of early November but failed to push on, presaging a broader, deeper fall. That might have put the entire climb up from October’s lows into sinister focus.
Now it’s still a little too early to rule out that possibility entirely but, a week later, it does look far less likely. The index did make a second top on November 28 but, had the formation held, then it seems most unlikely that the subsequent falls would have run into support as soon as they did.
So, if we write off the double top, what does that leave us with. Well, for the bulls it’s quite good news. For the other possibly scenario I wrote about last week was a pennant formation. And that seems to have been confirmed in spades.
As you can see the ASX bounced at the pennant’s uptrend base on December 5, only to peak out at its downtrend top on December 8.
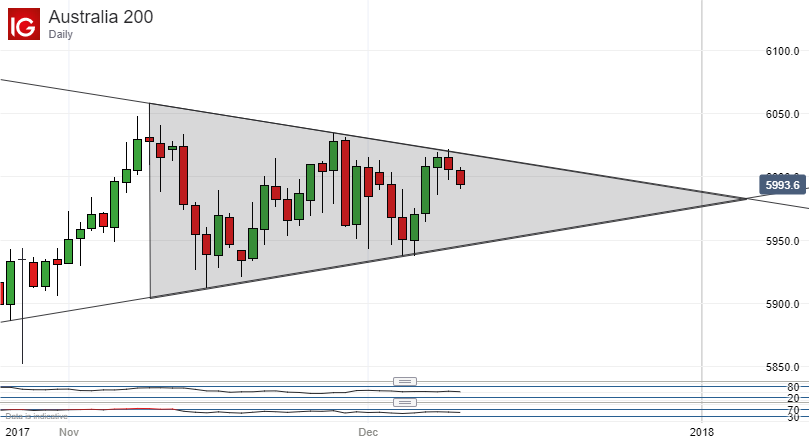
In short this pennant has plenty of confirmation and is usually seen as a ‘continuation pattern.’ What that means is that, once the pattern plays out, the market should continue to behave as it did before the pattern started. In this case of course that would mean that it starts to climb again. Of course, it could be some time before it does so. As you can see from the chart this formation could be with us until the early days of 2018.
But it certainly bears watching. Assuming it holds then support should come in around 5945, with subsequent resistance in the 6008 area. If we see another trough and peak around either of those levels, then it will be a very strong sign that this constructive pennant is holding and that the bulls can hope for good things.
A word of caution is order though. Pennant or no pennant the ASX has not looked particularly comfortable above the 6,000 mark for quite a long time. Forays there have been brief going all the way back to 2008. It will take a lot to overcome this ‘muscle memory’ even if the index’s climb resumes.
--- Written by David Cottle, DailyFX Research
Contact and follow David on Twitter: @DavidCottleFX


