Talking Points
- The ASX remains a little stuck, below the year’s highs but not too far below.
- Is it consolidating or getting ready for a fall?
- On balance the former looks likely but the uncommitted may want to wait.
Need help building confidence in your trading strategy? Check out our free guide !
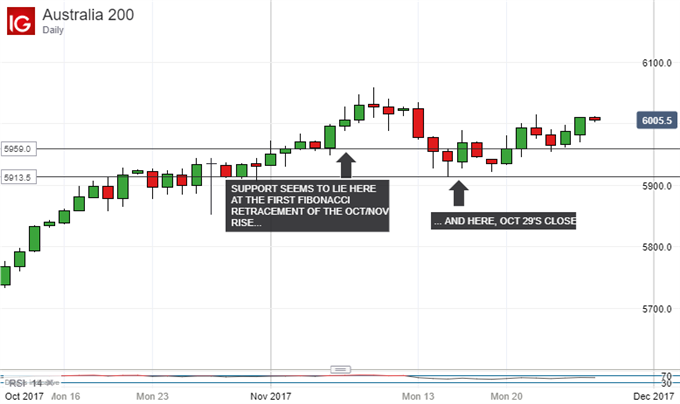
The ASX 200 index has retreated from its 2017 peak, but it hasn’t fallen far.
This pattern is to be seen across many developed market indexes, with the Nikkei 225 providing another excellent example. Investors are clearly happy to hold these stocks close to significant highs. In the ASX’s case 2017’s top had not been matched since early 2015 – and it wasn’t matched for long even then.
On a fundamental basis it’s tempting to assume that investors await two key developments which are close at hand. One is US Federal Reserve’s December monetary policy meeting. Rates are expected to rise on December 13 but the Fed has been notably cautious on the inflation outlook in the last couple of weeks, leaving markets desperate for clues as to how many more hikes may come. The second market focus is US tax cuts, with a bill through the House of Representatives and bound for the Senate.
Big moves either way seem unlikely until the markets know the end to both of these stories. The ASX seems to have found support in a band between 5959.0 and 5913.5. The former is 23.6% Fibonacci retracement of the sharp rise from October 5’s lows to that 2017 high- November 9’s 6056.7. The latter was November 15’s intraday low and a closing level from late October.

Should those fail, then 38.2% retracement at 5899.00 would probably come into focus.
However, at the moment its maddeningly unclear whether we are seeing a “classic” consolidation period or a far less reassuring double top formation on the chart. If the former, then the status quo ante should re-establish itself which should mean more gains. If the latter than October’s entire climb could be in question.
At present the consolidation scenario looks more likely. Momentum indicators have relaxed from the overbought conditions we saw earlier this month and while the index is very close to its 20-day moving average, the bullish crossover seen in early October when the 50-day topped the 100. None of this suggests an index about to swoon even if that double top also looks distinctly possible.
It might be best to play the range between current levels and the lows discussed earlier, at least until the picture becomes a little clearer. With that Fed meet looming there may not be very long to wait.
--- Written by David Cottle, DailyFX Research
Contact and follow David on Twitter: @DavidCottleFX


