


Talking Points:
- The ASX 200 has been stuck in broad range since its slide from 2017’s peak stopped
- The range doesn’t look in immediate danger of breaking either way
- However current price action could suggest an assault on its upper boundary in time
Polish your ASX 200 strategy with the Daily FX trading guide
The ASX 200 is in an interesting spot technically speaking, albeit one that makes a definitive view tricky.
Australia’s main equity benchmark has clearly stabilised after its fall from May 1’s high. That was also the peak for 2017 so far and the top of a long climb up from the lows of November 2016. The fall from it was arrested on June 7. Since then broad range-trading has been the pattern. The range top is May 16’s closing level of 5831. This is clearly something of a point to conjure with for the ASX, with the trading action holding around it for four straight days back then.

Meanwhile the lower bound is in the 5648 region. That has contained bearish adventurers for more than a month. The problem for forecasting is that, while the range holds, it’s very hard to say what might happen beyond that it will continue to. So obviously threats to either the upper or lower boundaries could be highly instructive.
And at the time of writing (0210GMT on Thursday, June 29), the index is showing a bit of fight which could turn interesting. It has just nosed above a downtrend line which has been in place ever since that May 1 peak. Admittedly the line may not have huge importance as its upper boundary consists of merely that top and one intraday high, that of June 1.
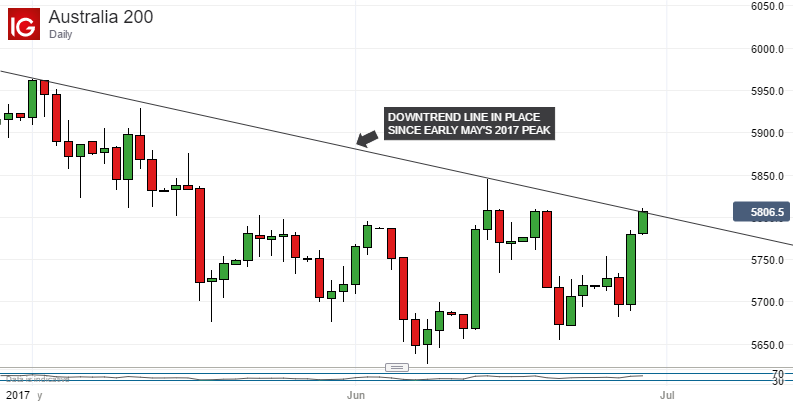
Still, it wouldn’t be unresonable to expect a daily or weekly close above it to portend at least a challenge to that current, broad range top at 5831. Of course failure at the same line probably means the range holds. But either way current action is certainly worth watching.
--- Written by David Cottle, DailyFX Research
Contact and follow David on Twitter: @DavidCottleFX


