


Talking Points:
- The ASX 200 loitered worryingly under January 9’s 19-month peak for nearly three weeks
- Now the bulls have girded themselves for another crack at it, and they are getting close
- What will happen if they get there will be key
For a while there Australia’s ASX 200 equity benchmark looked like an index in need of new direction.
Sure, it joined in the New Year optimists’ equity rally with a will. The ASX enjoyed a buying boost which took it up to 19-month highs on January 9. But that was more than 20 trading days ago. The index hasn’t slipped very far since, but it hadn’t shown much appetite to revisit those highs either.
Things changed five days back. Since then, Wall Street’s record-breaking vigor has helped the ASX chalk up five straight days of gains. That’s a line of green we haven’t seen for the Aussie index since its climb to that January peak of 5829.7.
Will it have the stomach to assault that peak again?
Well, it’s looking more and more like it. The bulls dealt with near-term technical resistance at 5739.80 on Monday. As long as the index can stay above there, then 5759.00 and 5796.60 will be the next hurdles to overcome. That second level would take it above January 9’s closing level, but still leave the index shy of the 5829.1 high traded on that day.
Can it get there? Well, this is likely to be a case of “one resistance at a time,” but the moving averages look supportive. At present 200-day moving average is some way below the 100-day (see chart below). These signals are not infallible, but a higher shorter term average is usually a bullish indicator.
Getting back to the peak: ASX 200
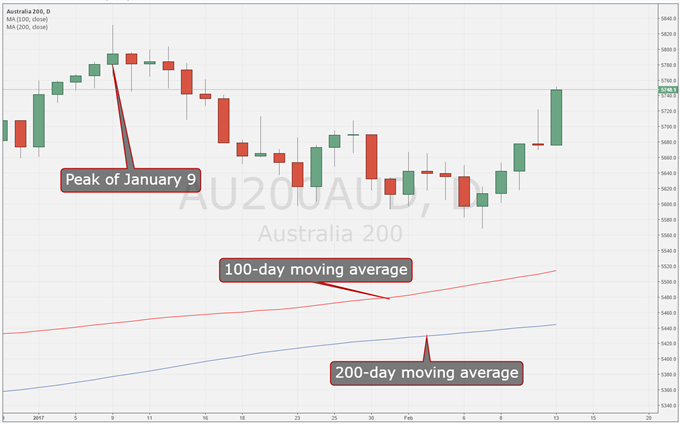
Chart Compiled Using TradingView
Technically speaking, a return to January 9’s peak probably looks more likely than not. However, what the ASX does if and when it gets there will be fascinating. A meaningful push higher will probably embolden the bulls, but another failure at that top will only see it become a more formidable barrier.
OK, so it’s your favorite currency, but is it anyone else’s? Check out the DailyFX sentiment page to find out.
--- Written by David Cottle, DailyFX Research
Contact and follow David on Twitter: @DavidCottleFX


