


Australian Dollar Outlook:
- AUD/JPY rates have been rejected at symmetrical triangle resistance as well as the ascending trendline from the March 2020 and August 2021 lows.
- Similarly, AUD/USD rates have failed after attempting to breakout above bullish falling wedge resistance.
- However, per the IG Client Sentiment Index, both AUD/JPY and AUD/USD rates retain bullish biases.

Risk Reversal Drags Down AUD
Both AUD/JPY and AUD/USD rates have had a strong first two weeks to February, following ‘risk’ higher, generally speaking: higher bond yields, which have hurt safe haven currencies; higher equity markets; and higher commodity prices. But today’s price action is disconcerting, to say the least. Rejections at critical resistance in both pairs suggests that the recent rallies may be exhausted in the short-term.
AUD/USD RATE TECHNICAL ANALYSIS: DAILY CHART (February 2021 to February 2022) (CHART 1)

For the past several weeks, AUD/USD rates have remained in the clutches of two multi-month technical patterns, the descending parallel channel in place since the end of June as well as the breakdown below the rising trendline from the March 2020 and August 2021 lows. A third pattern has emerged over the past three-plus months as well: a potential bullish falling wedge. But today’s price action has produced a strong reversal after reaching wedge resistance, the descending trendline from the October 2021 and January 2022 swing highs.
The pair is above their daily 5-, 8-, 13-, and 21-EMA envelope, which is in bullish sequential order. While daily Slow Stochastics are trending higher, they have yet to reach overbought territory, and while daily MACD is trending higher, it remains below its signal line. A lack of agreement among momentum indicators suggests that AUD/USD rates may pullback before another attempt at cracking wedge resistance.
IG Client Sentiment Index: AUD/USD RATE Forecast (February 10, 2022) (Chart 2)

AUD/USD: Retail trader data shows 51.31% of traders are net-long with the ratio of traders long to short at 1.05 to 1. The number of traders net-long is 12.51% lower than yesterday and 8.00% lower from last week, while the number of traders net-short is 0.41% lower than yesterday and 13.79% higher from last week.
We typically take a contrarian view to crowd sentiment, and the fact traders are net-long suggests AUD/USD prices may continue to fall.
Yet traders are less net-long than yesterday and compared with last week. Recent changes in sentiment warn that the current AUD/USD price trend may soon reverse higher despite the fact traders remain net-long.
AUD/JPY RATE TECHNICAL ANALYSIS: DAILY CHART (February 2021 to February 2022) (CHART 3)
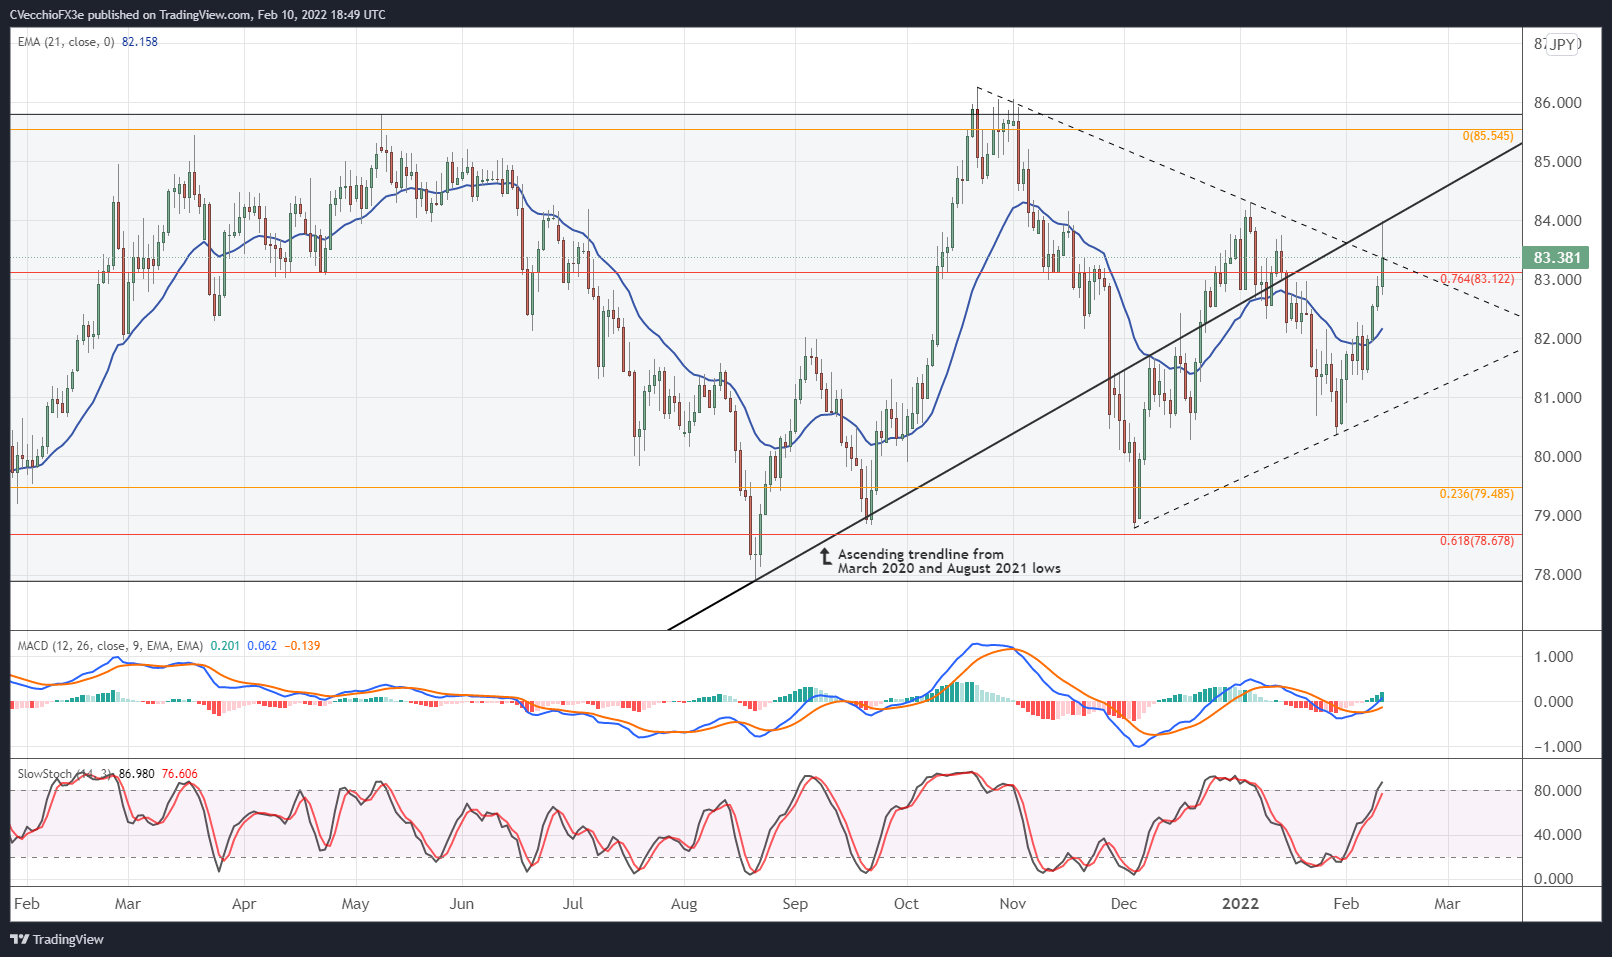
AUD/JPY rates remain in the middle of their year-long range, finding resistance at two critical levels today: symmetrical triangle resistance from the October 2021 and January 2022 swing highs; and the ascending trendline from the March 2020 and August 2021 lows. A short-term pullback may transpire before another attempt to break through this confluence of resistance, which when cleared, would signal greater potential for a return to 86.00.
Bullish momentum remains strong, emboldening a ‘buy the dip’ perspective. The pair is above their daily 5-, 8-, 13-, and 21-EMA envelope, which is in bullish sequential order. Daily MACD is beginning to trend higher through its signal line, while daily Slow Stochastics are heading into overbought territory. All things considered, AUD/JPY rates have a more appealing technical setup than AUD/USD rates, should a bullish resolution take place.
IG Client Sentiment Index: AUD/JPY Rate Forecast (February 10, 2022) (Chart 4)
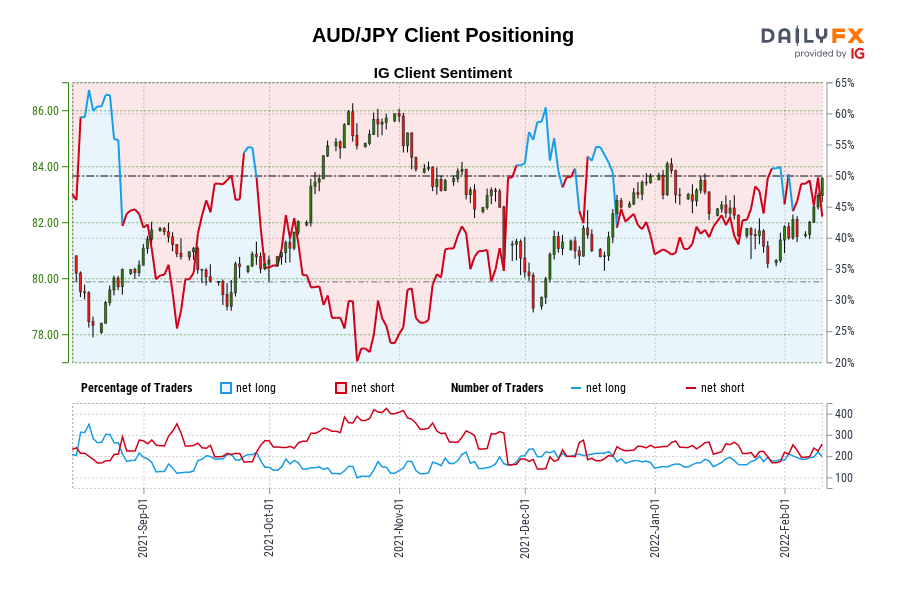
AUD/JPY: Retail trader data shows 39.19% of traders are net-long with the ratio of traders short to long at 1.55 to 1. The number of traders net-long is 16.67% lower than yesterday and 9.84% lower from last week, while the number of traders net-short is 7.56% higher than yesterday and 25.49% higher from last week.
We typically take a contrarian view to crowd sentiment, and the fact traders are net-short suggests AUD/JPY prices may continue to rise.
Traders are further net-short than yesterday and last week, and the combination of current sentiment and recent changes gives us a stronger AUD/JPY-bullish contrarian trading bias.
--- Written by Christopher Vecchio, CFA, Senior Strategist


