AUD/USD Technical Outlook
- AUD/USD coming off big long-term support to the start week
- Risk trends likely to dictate if and when it breaks
AUD Technical Outlook: AUD/USD Holding Long-term Support, For Now
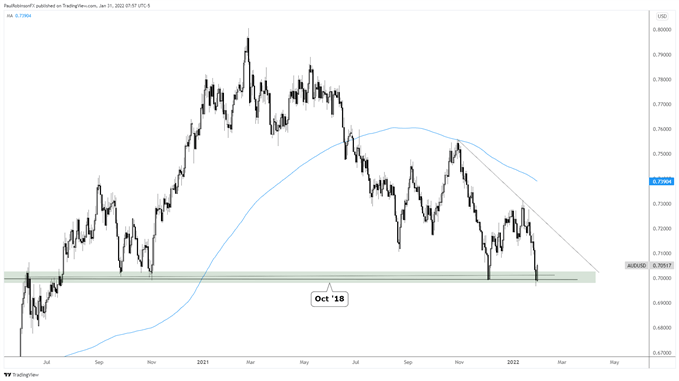
AUD/USD is looking to extend the downward trend dating to Feb of last year, but for it to do that a major level will need to break. A bounce is currently developing from right around 7000, a level that has become increasingly more significant since October 2018.
It hasn’t always been the most reliable level with a couple of major swings developing above and below it, but nevertheless it has still held a good deal of meaning at times. Most recently, it held as support in December. So for, for a day at least, we are seeing another reaction of this important level.
The thinking is that it will hold for the time being as long as general risk trends can firm up here. A bounce in-line with the nearly one-year-long trend could be a corrective one, though, that ends up leading to another major leg lower. The highest AUD/USD is seen as rising at this time is to the trend-line from October, somewhere in the mid-7100s.
Breaking 7000 with conviction is viewed as a catalyst that will lead to much sharper losses and likely taking place with equities and other risky assets declining. The correlation between AUD and the S&P 500 is often positive; it’s current one-month correlation is 0.67. If markets go into a full-on de-risking mode that correlation is likely to strengthen even more.
For now, traders should respect the 7000 level as support given its ability to continue proving it as such. But at some point we could see it give-way and lead to further losses. Also continue to monitor general risk trends.
AUD/USD Daily Chart

Resources for Forex Traders
Whether you are a new or experienced trader, we have several resources available to help you; indicator for tracking trader sentiment, quarterly trading forecasts, analytical and educational webinars held daily, trading guides to help you improve trading performance, and one specifically for those who are new to forex.
---Written by Paul Robinson, Market Analyst
You can follow Paul on Twitter at @PaulRobinsonFX


