


Australian Dollar Outlook:
- Both AUD/JPY and AUD/USD have been crushed in August. But the charts suggest that near-term bottoms may be forming as morning star candlestick patterns have emerged.
- Weakness in the AUD-crosses isn’t a surprise given the historical weak seasonal tendency exhibited by the Aussie, but delta variant concerns exacerbated selling.
- According to the IG Client Sentiment Index, both AUD/JPY and AUD/USD rates have bullish biases in the near-term.

A Ray of Sun?
It hasn’t been a good month for the Australian Dollar. In mid-July it was noted that there was “nothing to like, no saving grace” for the Aussie, and at the start of August the data suggested a weak seasonal tendency could weigh on AUD-crosses. Both of those perspectives, as time has told, underplayed the weakness that was about to plague the Australian Dollar. Delta variant concerns have crippled the Australian economy, and now the Reserve Bank of Australia is on its backfoot with respect to stimulus withdrawal – far behind its major counterparts.
Alas, the worst may be over – at least for now. Emerging morning star candlestick patterns in both AUD/JPY and AUD/USD rates speak to bottoming potential in the near-term, with the Aussie buttressed by the fact that industrial base metals – copper, iron ore, nickel – are starting to climb.
AUD/USD RATE TECHNICAL ANALYSIS: DAILY CHART (March 2020 to August 2021) (CHART 1)
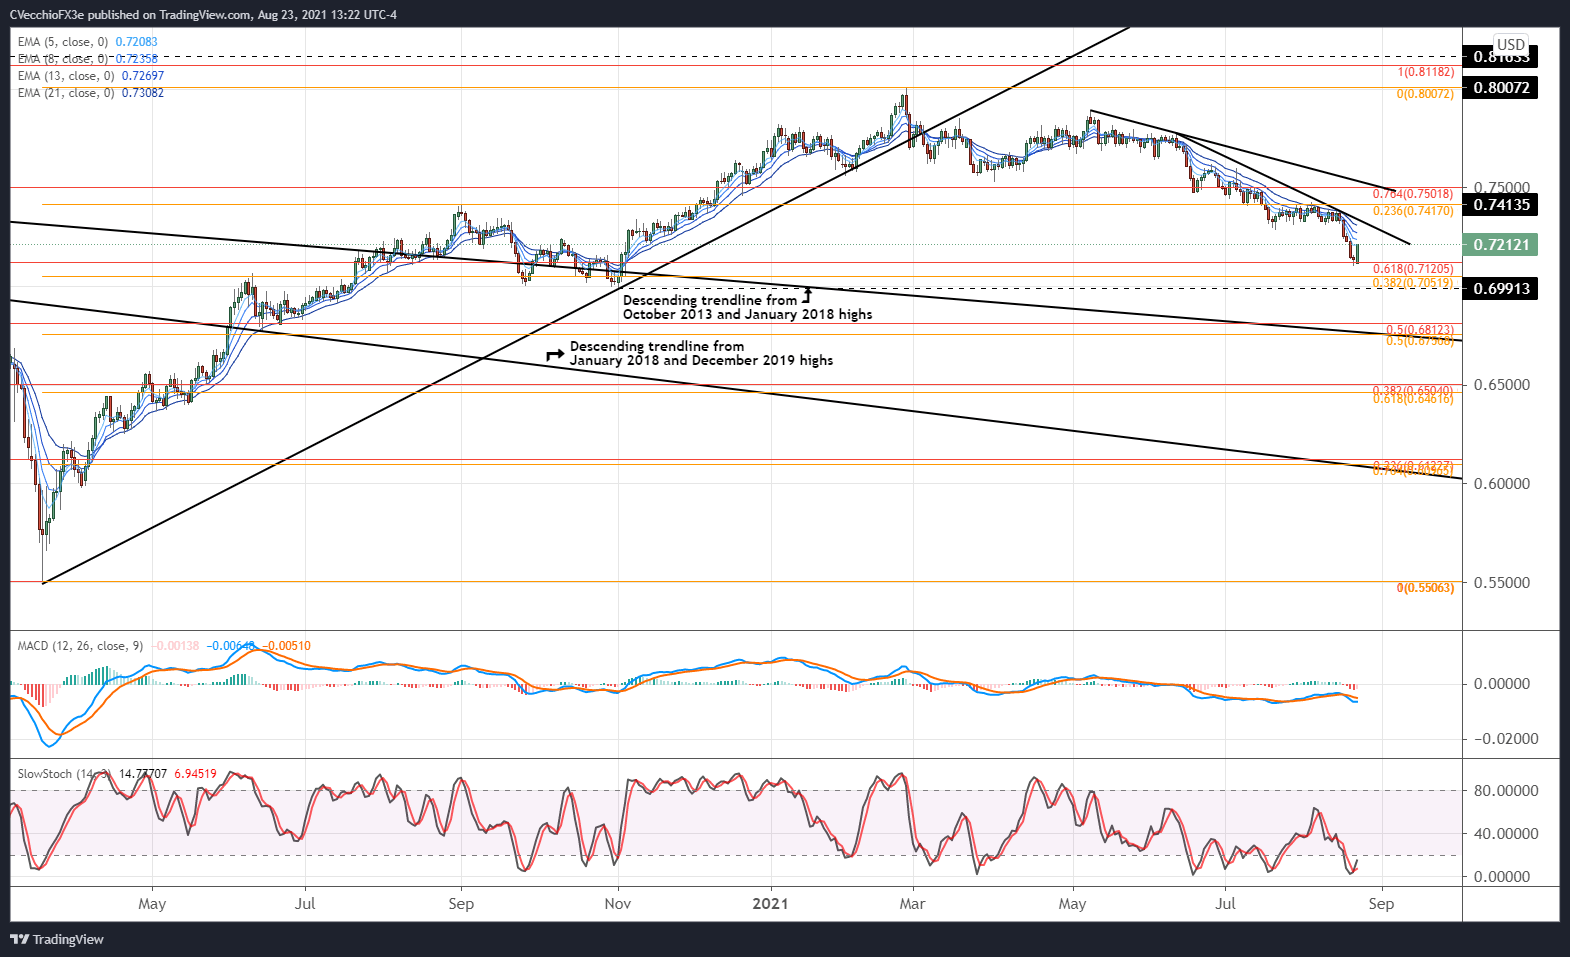
AUD/USD rates are establishing a morning star candlestick pattern, a three-candle cluster that hints at a near-term bottom. Support has been found ahead of a confluence of technical support: the 38.2% Fibonacci retracement of the 2020 low/2021 high range at 0.7052; the 61.8% retracement of the 2018 high/2020 low range at 0.7125; and the November 2020 swing low at 0.6991.
It’s too soon to say that this is the bottom for AUD/USD, however, as the pair’s momentum profile still has bearish inclinations. The pair is below its daily 5-, 8-, 13-, and 21-EMA envelope, which is still in bearish sequential order. Daily MACD drop below its signal line persists, while daily Slow Stochastics have yet make their way out of oversold territory.

IG Client Sentiment Index: AUD/USD RATE Forecast (August 23, 2021) (Chart 2)
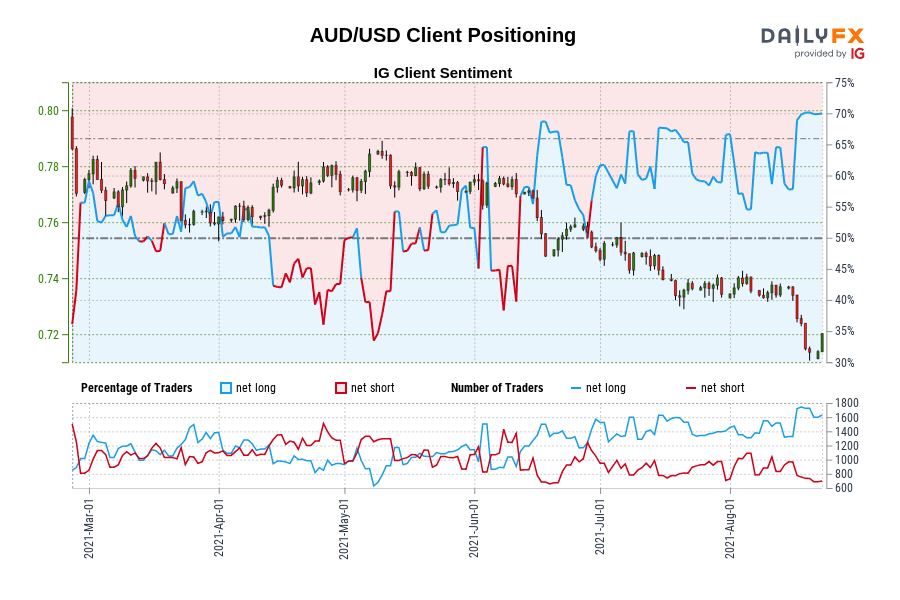
AUD/USD: Retail trader data shows 70.14% of traders are net-long with the ratio of traders long to short at 2.35 to 1. The number of traders net-long is 5.66% higher than yesterday and 8.67% higher from last week, while the number of traders net-short is 3.18% higher than yesterday and 16.07% lower from last week.
We typically take a contrarian view to crowd sentiment, and the fact traders are net-long suggests AUD/USD prices may continue to fall.
Traders are further net-long than yesterday and last week, and the combination of current sentiment and recent changes gives us a stronger AUD/USD-bearish contrarian trading bias.
AUD/JPY RATE TECHNICAL ANALYSIS: DAILY CHART (March 2020 to August 2021) (CHART 3)
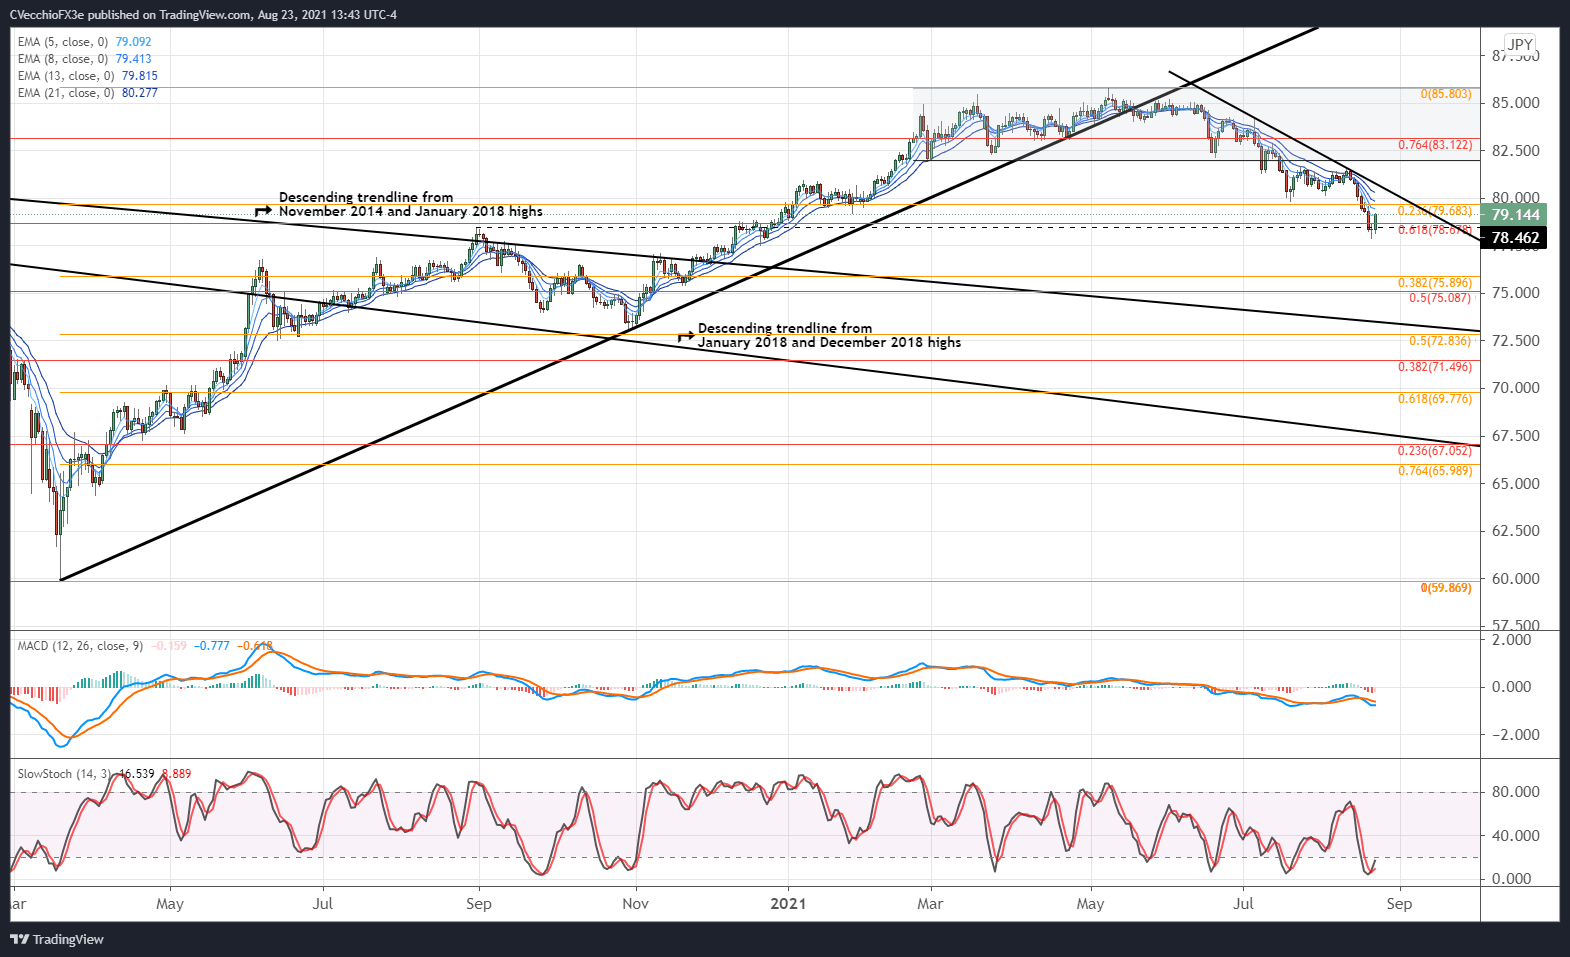
Like AUD/USD, AUD/JPY rates are working on a morning star candlestick pattern. Also like AUD/USD, AUD/JPY has found support amid a confluence of technical support: the August 2020 high at 78.46; the 61.8% Fibonacci retracement of the 2018 high/2020 low range at 78.68; and the 23.6% Fibonacci retracement of the 2020 low/2021 high range at 79.68. Moreover,
AUD/JPY’s momentum profile remains bearish: the pair is below its daily EMA envelope, which is still in bearish sequential order; daily MACD is trending lower below its signal line; and daily Slow Stochastics are still in oversold territory. This may not be the bottom, but like in AUD/USD, the seeds are planted for a turn higher in AUD/JPY.
IG Client Sentiment Index: AUD/JPY Rate Forecast (August 23, 2021) (Chart 4)
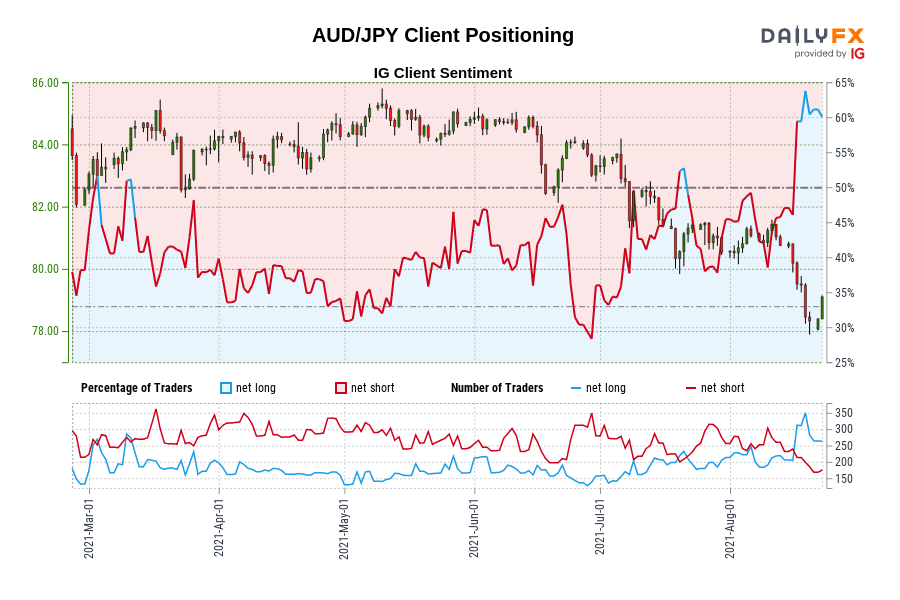
AUD/JPY: Retail trader data shows 64.08% of traders are net-long with the ratio of traders long to short at 1.78 to 1. The number of traders net-long is 15.44% higher than yesterday and 17.16% higher from last week, while the number of traders net-short is 1.68% lower than yesterday and 17.37% lower from last week.
We typically take a contrarian view to crowd sentiment, and the fact traders are net-long suggests AUD/JPY prices may continue to fall.
Traders are further net-long than yesterday and last week, and the combination of current sentiment and recent changes gives us a stronger AUD/JPY-bearish contrarian trading bias.

--- Written by Christopher Vecchio, CFA, Senior Currency Strategist


