


Australian Dollar Outlook:
- Both AUD/JPY and AUD/USD rates are trading in negative territory at their daily lows, despite having been positive earlier on the session. Bearish engulfing/piercing candles are taking shape.
- Another spike in US Treasury yields following the flat reaction to the March Fed meeting is spooking equity markets, with risk parity models (long bonds and long stocks) suffering. This is a bad sign for risk appetite.
- According to the IG Client Sentiment Index, both major AUD-crosses have a mixed bias in the near-term.
Australian Dollar Follows Risk Down
The Australian Dollar had been clawing its way higher over the course of the week, but more volatility in global bond yields has spooked equity markets, dragging down risk appetite. With risk parity models suffering – long bonds and long stocks – we may be entering another period of choppy trading as asset allocation shifts prove to be the dominant thematic trade.

AUD/USD RATE TECHNICAL ANALYSIS: DAILY CHART (March 2020 to March 2021) (CHART 1)
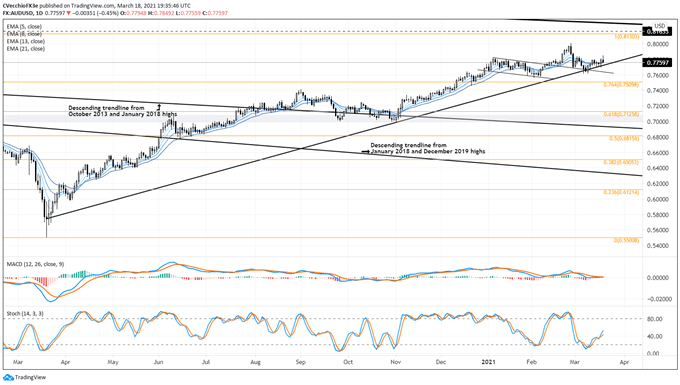
AUD/USD’s rally hit pause with the reversal in risk appetite, and now a bearish daily hammer candle is forming; depending upon the close, a bearish key reversal could emerge (if today’s close is below yesterday’s low). Like what was seen at the end of February, the sharp reversal today could be an omen of choppier price action ahead. AUD/USD rates are already in vulnerable territory, sitting at the uptrend from the February and November 2020 lows – the pandemic uptrend.

IG Client Sentiment Index: AUD/USD RATE Forecast (March 18, 2021) (Chart 2)
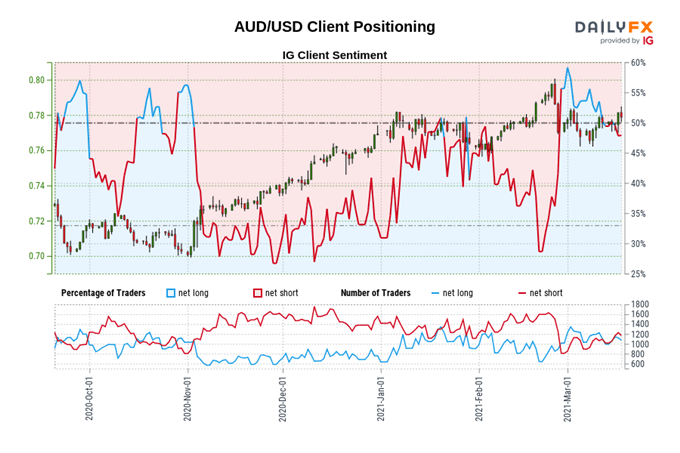
AUD/USD: Retail trader data shows 49.61% of traders are net-long with the ratio of traders short to long at 1.02 to 1. The number of traders net-long is 13.13% lower than yesterday and 1.74% lower from last week, while the number of traders net-short is 9.93% lower than yesterday and 4.47% lower from last week.
We typically take a contrarian view to crowd sentiment, and the fact traders are net-short suggests AUD/USD prices may continue to rise.
Positioning is more net-short than yesterday but less net-short from last week. The combination of current sentiment and recent changes gives us a further mixed AUD/USD trading bias.
AUD/JPY RATE TECHNICAL ANALYSIS: DAILY CHART (March 2020 to March 2021) (CHART 3)

In the previous update, it was noted that “if there is a pullback in the major AUD-crosses, AUD/JPY rates appear less likely to suffer in the current environment than AUD/USD rates.” This has borne out, and remains likely to be the case going forward. Like AUD/USD, AUD/JPY rates are working on a daily bearish hammer, not quite a bearish key reversal just yet. Still above its daily EMA envelope, it’s too early to say that this is the top.
IG Client Sentiment Index: AUD/JPY Rate Forecast (March 18, 2021) (Chart 4)
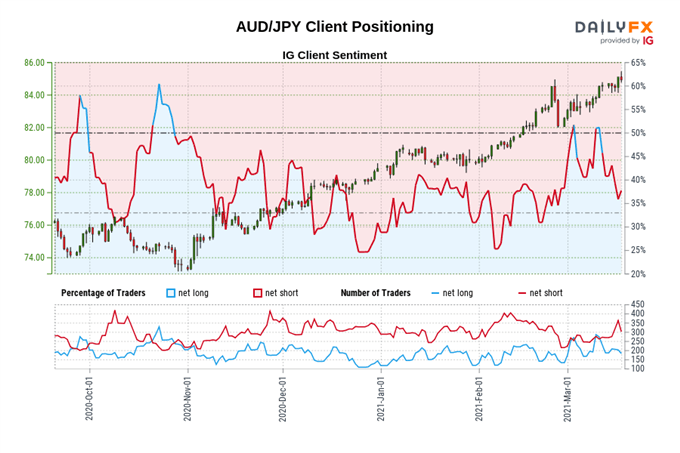
AUD/JPY: Retail trader data shows 40.52% of traders are net-long with the ratio of traders short to long at 1.47 to 1. The number of traders net-long is 8.37% lower than yesterday and 17.33% lower from last week, while the number of traders net-short is 27.78% lower than yesterday and 0.74% higher from last week.
We typically take a contrarian view to crowd sentiment, and the fact traders are net-short suggests AUD/JPY prices may continue to rise.
Positioning is less net-short than yesterday but more net-short from last week. The combination of current sentiment and recent changes gives us a further mixed AUD/JPY trading bias.
--- Written by Christopher Vecchio, CFA, Senior Currency Strategist


