


Australian Dollar, AUD/USD, AUD/JPY, AUD/NZD, Time-Cycle Analysis – Talking Points:
- Long-term cycle analysis suggests a cyclical upturn is at hand for AUD/USD.
- Swelling bullish momentum hints at further gains for AUD/JPY.
- AUD/NZD at risk of extended losses as price carves out a Double Top reversal pattern.
The Australian Dollar looks poised to continue outperforming the haven-associated US Dollar and Japanese Yen in the coming weeks. However, the New Zealand Dollar may claw back lost ground against its trans-Tasman counterpart. Here are the key levels to watch for AUD/USD, AUD/JPY and AUD/NZD rates.
AUD/USD Monthly Chart – Cyclical Upturn at Hand

AUD/USD monthly chart created using Tradingview
The chart above highlights the cyclical nature seen in AUD/USD rates over the past 24 years, with the currency pair largely adhering to what appears to be an 8-year rotation. It has set significant bottoms in early 2001, late 2008 and 2016.
Recent price action looks strikingly similar to that seen early in the bullish cycle ignited in September 2001 and could be indicative of further upside for AUD/USD, given price has surged away from long-term trend resistance-turned-support extending from the 2013 high and remains constructively perched above 0.7600.
Moreover, with the RSI breaking above the downtrend extending from the 2004 extremes – in a similar fashion to late 2002 – a shift in overall market sentiment seems to be taking shape.
With that in mind, the trade-sensitive exchange rate could be poised to substantially extend its recent 44% surge from the March 2020 nadir, with cycle analysis suggesting AUD/USD may rise as much as 33% from current levels to eventually peak in late 2025.
AUD/USD Daily Chart – RSI Divergence Hints at Bullish Exhaustion

AUD/USD daily chart created using Tradingview
Although the long-term technical outlook for the AUD/USD remains overtly bullish, the formation of a bearish Hanging Man candle, in combination with bearish RSI divergence, suggests that prices may consolidate before continuing to push higher.
That being said, a daily close above the February 23 high (0.7935) would probably intensify buying pressure and open the door for a challenge of psychological resistance at 0.8000. A convincing push above that brings the 2018 high (0.8136) into the crosshairs .
However, if 0.8000 remains intact, a short-term pullback to confluent support at the Pitchfork median line and 8-EMA (0.7848) could be on the cards.
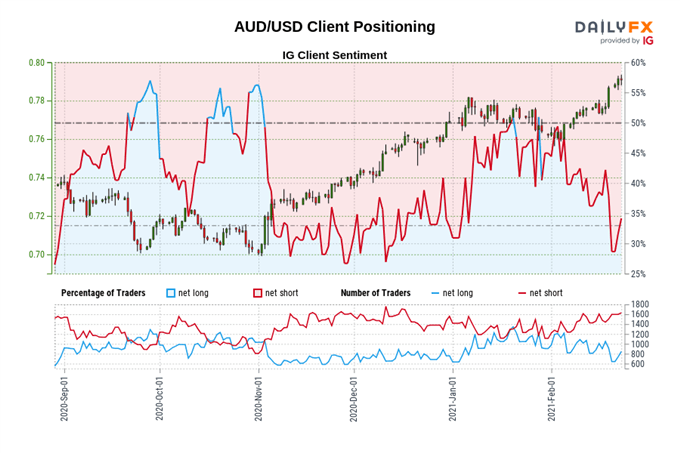
The IG Client Sentiment Report shows 36.78% of traders are net-long with the ratio of traders short to long at 1.72 to 1. The number of traders net-long is 12.33% higher than yesterday and 2.98% lower from last week, while the number of traders net-short is 3.39% lower than yesterday and 4.82% higher from last week.
We typically take a contrarian view to crowd sentiment, and the fact traders are net-short suggests AUD/USD prices may continue to rise.
Positioning is less net-short than yesterday but more net-short from last week. The combination of current sentiment and recent changes gives us a further mixed AUD/USD trading bias.
AUD/JPY Daily Chart – RSI Extremes Hint at Further Upside

AUD/JPY daily chart created using Tradingview
AUD/JPY rates have stormed higher in February, surging over 4.8% higher to slice through a flurry of key resistance levels.
With the RSI surging to its highest levels since June 2020, and the MACD tracking firmly above its neutral midpoint, these gains look set to continue in the coming months.
Holding constructively above the 61.8% Fibonacci (83.17) probably paves the way for the exchange rate to challenge the June 2018 high (84.54). Clearing that brings the 78.6% Fibonacci (86.01) into play.
Alternatively, slipping back below 81.00 could neutralize near-term buying pressure and allow sellers to drive price back to former resistance-turned-support at 82.20.
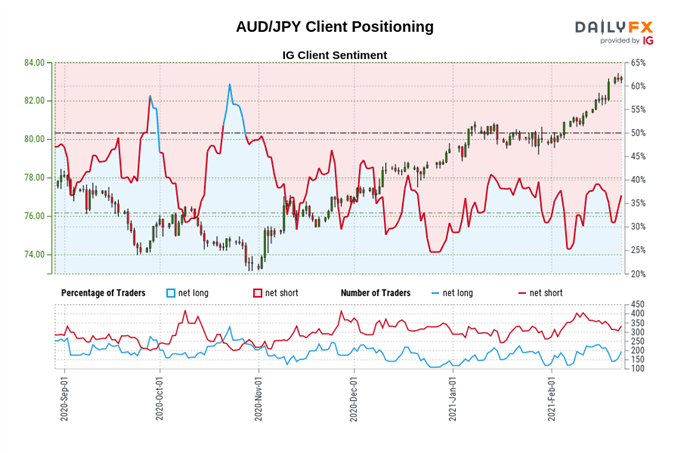
The IG Client Sentiment Report shows 34.38% of traders are net-long with the ratio of traders short to long at 1.91 to 1. The number of traders net-long is 1.73% higher than yesterday and 17.76% lower from last week, while the number of traders net-short is 1.51% higher than yesterday and 3.45% lower from last week.
We typically take a contrarian view to crowd sentiment, and the fact traders are net-short suggests AUD/JPY prices may continue to rise.
Positioning is less net-short than yesterday but more net-short from last week. The combination of current sentiment and recent changes gives us a further mixed AUD/JPY trading bias.
AUD/NZD Daily Chart – Double Top Reversal in Play?

AUD/NZD daily chart created using Tradingview
The Australian Dollar’s surge higher against its trans-Tasman counterpart could be coming to an end, as prices carve out a Double Top reversal pattern just shy of key psychological resistance at 1.0800.
Bearish RSI and MACD divergence, in combination with a Shooting Star reversal candle, suggests that the path of least resistance is lower.
A daily close back below confluent support at the November 2020 high (1.0759) and the 8-EMA would likely intensify near-term selling pressure and carve a path for price to challenge the 100-MA (1.0669). Hurdling that brings the Double Top neckline at the February low (1.0541) into focus.
Conversely, a daily close above the January high (1.0843) would probably invalidate the bearish reversal pattern and pave the way for buyers to challenge psychological resistance at 1.0900.
-- Written by Daniel Moss, Analyst for DailyFX
Follow me on Twitter @DanielGMoss


