


Aussie Dollar vs US Dollar Technical Forecast
- Will bulls give up control?
- The key levels and signals to keep track of
AUD/USD – Interrupted Rally
On Thursday, AUD/USD printed its highest level in over seven weeks at 0.6569. However, the price retreated after, as some bulls seemed to cut back. As a result, on Friday the market closed the weekly candlestick with a bearish Doji pattern, reflecting bulls indecision at this stage.
Alongside that, the Relative Strength Index (RSI) fell from 67 to 55, highlighting a weaker bullish momentum.
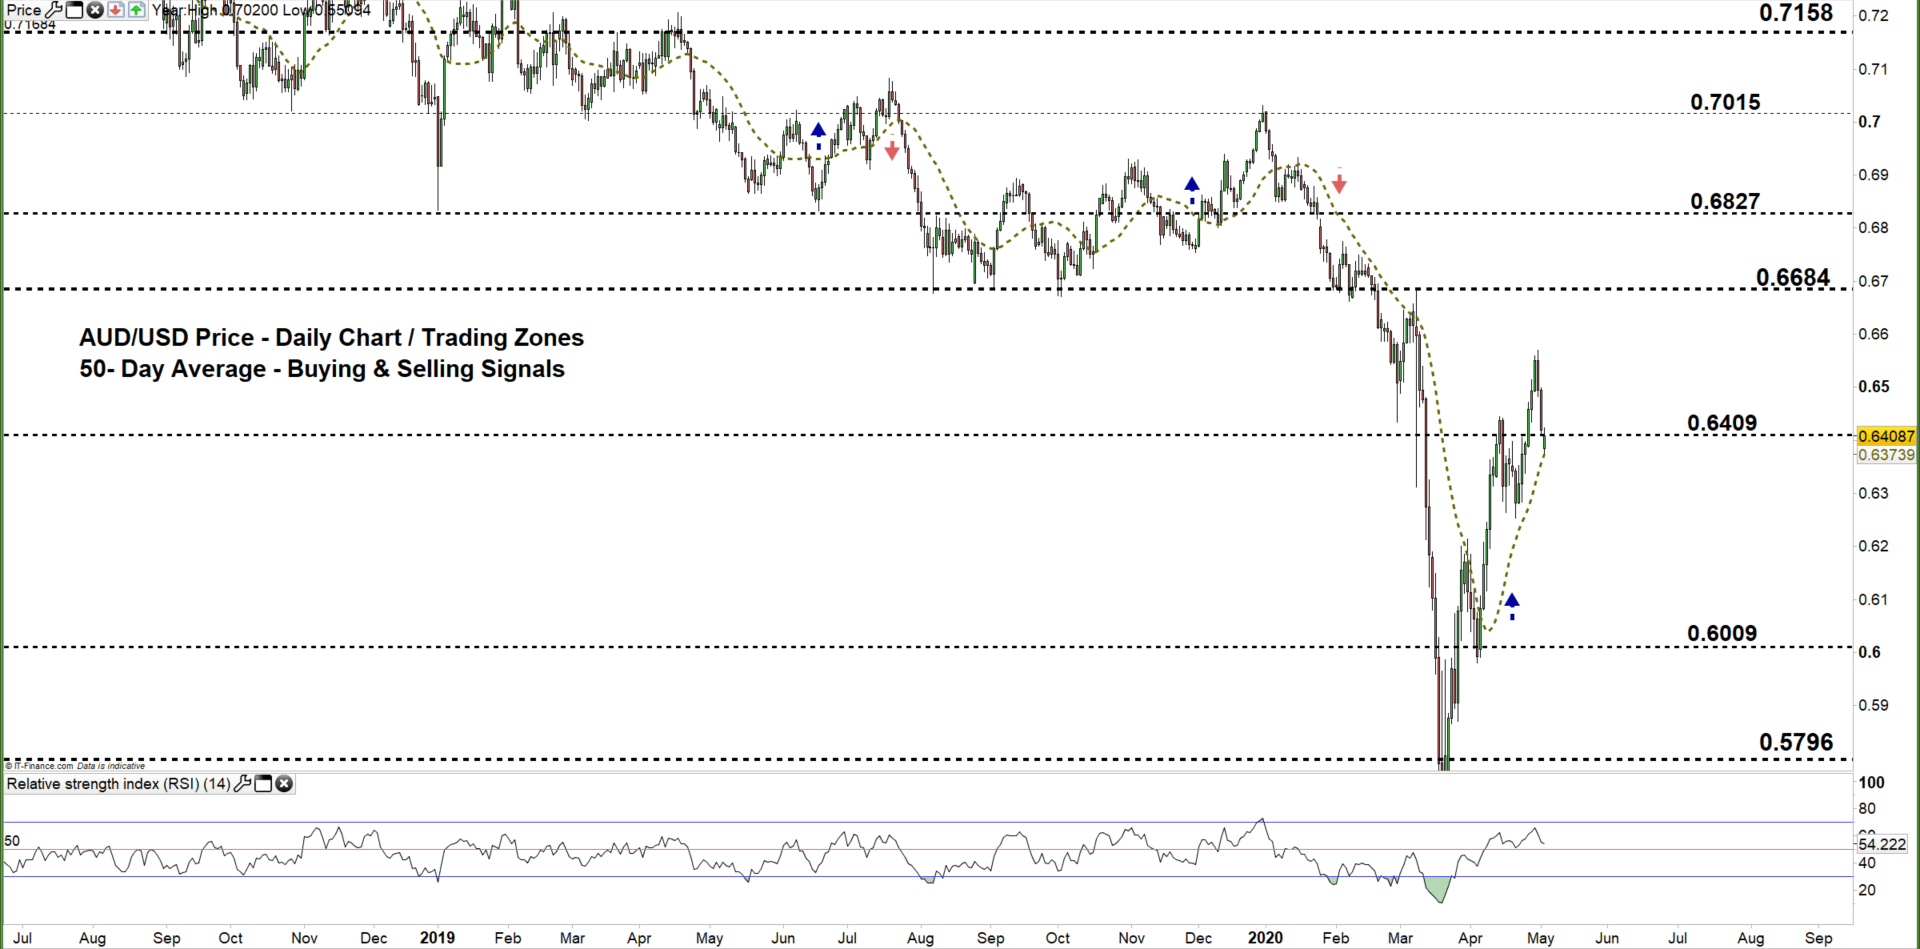
AUD/USD DAILY PRICE CHART (June 29, 2018 – May 4, 2020) Zoomed Out

AUD/USD DAILY PRICE CHART (FEB 20 – May 4, 2020) Zoomed IN

Looking at the daily chart, I noticed that on April 24 AUD/USD broke above the downtrend line originated from the March 9 high at 0.6685, and produced a bullish signal. On the following day, the price rallied to the current trading zone 0.6409 – 0.6684 generating another bullish signal.
On Thursday, the pair pointed lower for a test of the low end of the aforementioned zone. Hence, a close below the low end signals more hesitation from bull’s side and may trigger a sell-off towards 0.6009. A further close below that level could send AUDUSD even lower towards 0.5796. That being said, the weekly support levels underscored on the chart should be kept in focus.
On the other hand, any failure in closing below the low end of the zone indicates that bullish momentum is still intact. Thus, bulls could re-attempt pushing towards the high end of the zone. A further close above that level may extend this rally towards 0.6827. In that scenario, the weekly resistance levels marked on the chart should be considered.

AUD/USD Four-Hour PRICE CHART (April 6 – May 4, 2020)

From the four- hour chart, I noticed that last week, AUD/USD resumed bullish price action and created higher highs with higher lows. However, on Friday the pair corrected lower after breaking below the uptrend line originated from the April 3 low at 0.5980.
A break below 0.6368 could send AUDUSD towards 0.6269. Yet, the daily support level underlined on the chart should be watched closely. In turn, any break in the other direction i.e. above 0.6459 may cause a rally towards 0.6543. Nevertheless, the daily resistance level printed on the chart should be monitored.
See the chart to find out more about the key technical levels in a further bullish/bearish scenario.

Written By: Mahmoud Alkudsi, Market Analyst
Please feel free to contact me on Twitter: @Malkudsi


