


AUD/USD TECHNICAL OUTLOOK: BEARISH
- Australian Dollar rebound meets stiff resistance at 0.60 figure
- Near-term chart positioning hints downtrend may be resuming
- Trader sentiment studies challenging the bearish narrative
The Australian Dollar turned higher against its US counterpart after sliding to an almost 8-year low below the 0.56 figure. Prices climbed above initial resistance at 0.5869, the 23.6% Fibonacci expansion, but the move higher was met with stiff pushback at former support marked by the October 2008 low at 0.6009.
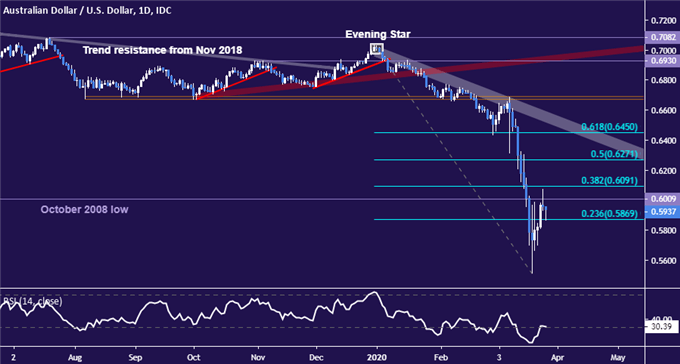
AUD/USD daily chart created with TradingView
Turning to the four-hour chart for a sense of the nearer-term trajectory, it seems as though prices are resuming the dominant downtrend having broken upward-sloping support set from the March 18 low. The swing top is marked by a bearish Evening Star candlestick pattern.
If the trend line holds up as resistance on a retest, bearish resumption may see prices probe back down to the 38.2% Fibonacci expansion at 0.5623. Alternatively, invaliding topping cues would entail pushing above Evening Star formation high at 0.6073 and securing a foothold there.
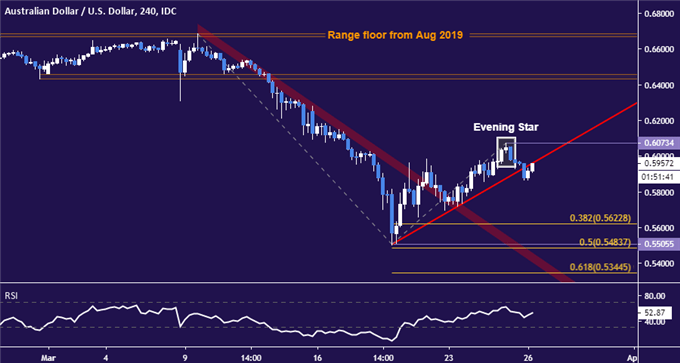
AUD/USD 4-hour chart created with TradingView
AUD/USD TRADER SENTIMENT
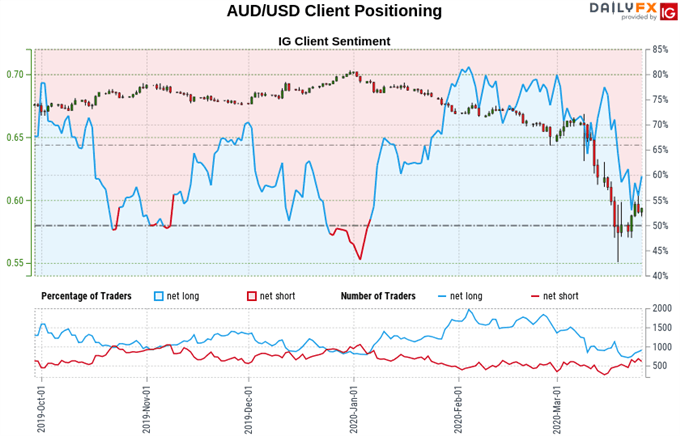
Retail sentiment data shows 58.41% of traders are net-long, with the long-to-short ratio at 1.40 to 1. IG Client Sentiment (IGCS) is typically used as a contrarian indicator, so traders being net-long suggests AUD/USD may continue to fall.
However, the net-long skew in overall positioning has diminished relative to the prior session and the week before. This warns that while the aggregate bias remains bearish, recent changes in traders’ exposure warn that a reversal higher may be brewing ahead.
See the full IGCS sentiment report here.

FX TRADING RESOURCES
- Just getting started? See our beginners’ guide for FX traders
- Having trouble with your strategy? Here’s the #1 mistake that traders make
- Join a free live webinar and have your trading questions answered
--- Written by Ilya Spivak, Currency Strategist for DailyFX.com
To contact Ilya, use the comments section below or @IlyaSpivak on Twitter


