


Aussie Dollar vs US Dollar Technical Outlook
Bears in Control
On Friday, AUD/USD tumbled to its lowest level in over eleven years at 0.6123, then rallied after as some bears seemed to cover. Yet, the market closed the weekly candlestick in the red with 6.9% loss.
Alongside that, the relative Strength Index (RSI) dipped below 70 then remained in oversold territory, signalling a powerful downtrend move.
AUD/USD DAILY PRICE CHART (DEC 1, 2018 – Mar 20, 2020) Zoomed Out


AUD/USD DAILY PRICE CHART (Feb 1 – MAR 20, 2020) Zoomed IN

Looking at the daily chart, we noticed that last week AUD/USD rebounded from 0.6685, then plunged slipping from a trading zone to a lower. Yesterday, the price closed with a Doji pattern highlighting a possible price reversal. Today, the pair has rallied to a higher trading zone 0.5796 – 0.6009 as more bears seemed to exit the market.
Thus, a close above the high end of the zone may extend the rally towards 0.6112. Further close above that level could send the price even higher towards 0.6281. That said, the daily resistance levels marked on the chart (zoomed in) should be considered.
In turn, any close below the low end of the zone could encourage bears to press towards 0.5393. Further close below that level opens the door for more bearishness towards 0.5246. Yet, the weekly/ monthly support levels underscored on the chart should be monitored.

AUD/USD Four-Hour PRICE CHART (Mar 5 – Mar 20, 2020)
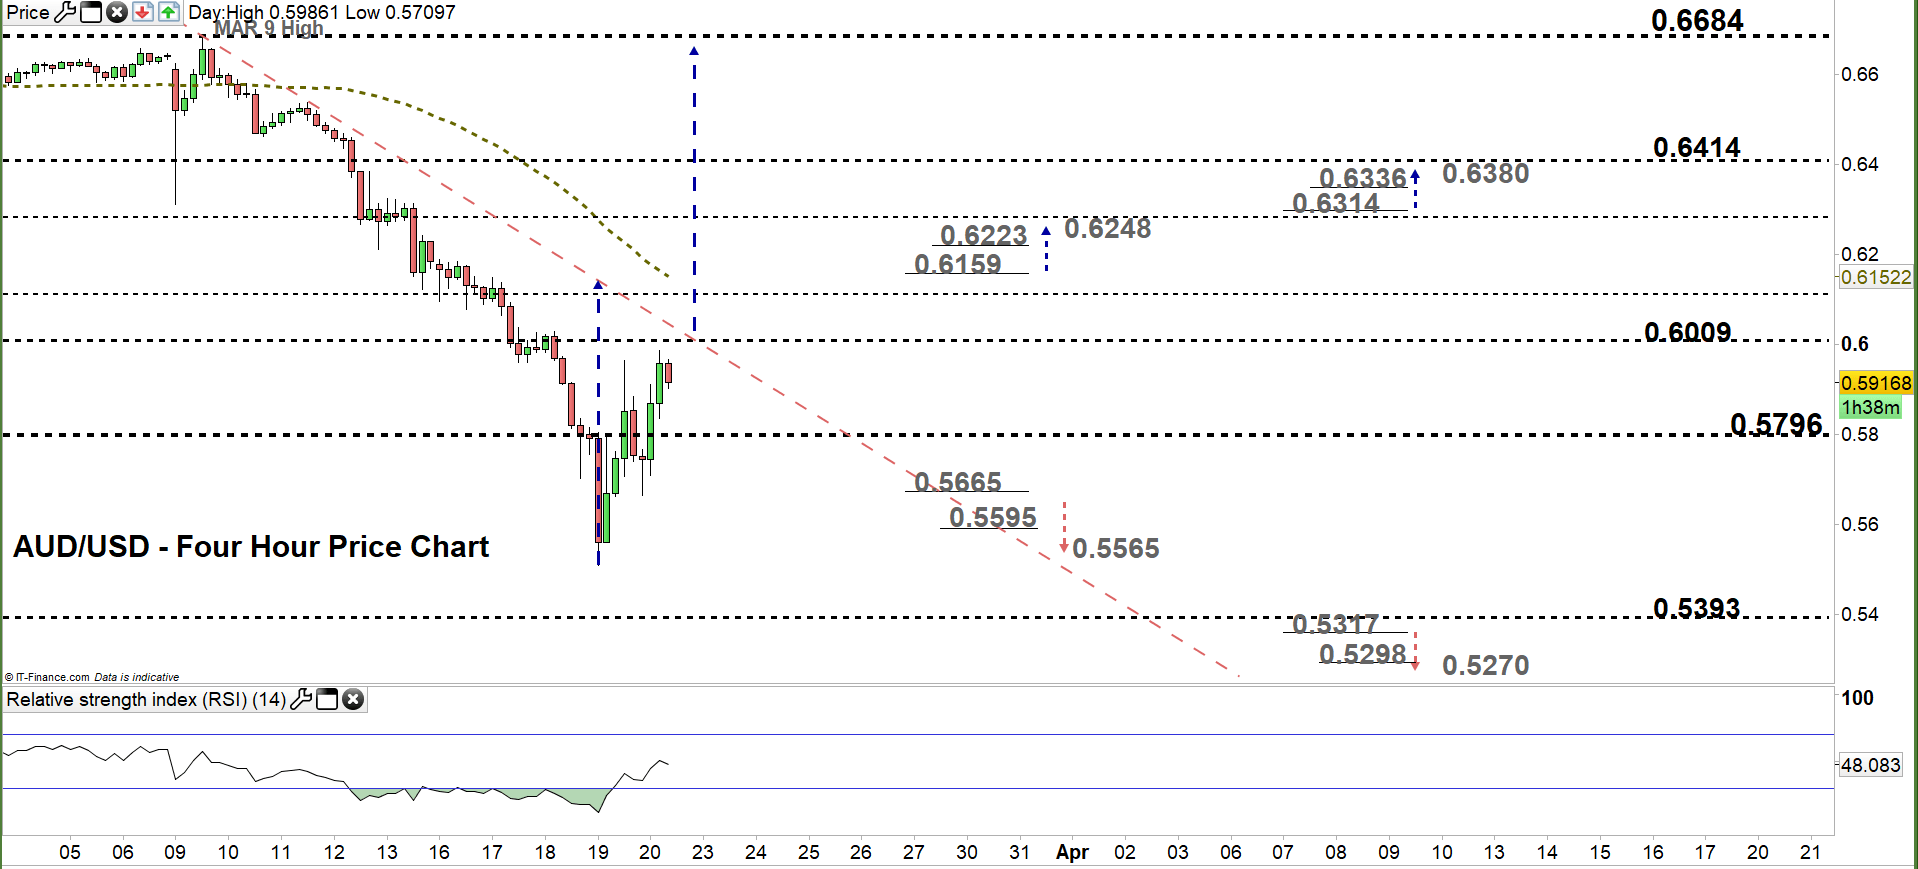
From the four- hour chart, we noticed that yesterday AUD/USD rebounded from 0.5509 – its lowest level in nearly 18 years. The price rallied after, eyeing a test of the downtrend line originated from the March 9 high at 0.6685. Any violation of this line would be considered as a bullish signal.
Thus, a break above 0.6159 may cause a rally towards 0.6248. Although, the daily resistance level underlined on the chart should be kept in focus. Any break on the other side i.e. below 0.5665 could send AUDUSD even lower towards 0.5565. Nevertheless, the daily support printed on the chart should be watched closely.

Written By: Mahmoud Alkudsi
Please feel free to contact me on Twitter: @Malkudsi


