


AUD/USD, NZD/USD TECHNICAL OUTLOOK: BEARISH
- Australian Dollar sinks past 2008 financial crisis low vs US Dollar
- Levels unseen in two decades may be reachable on a support break
- New Zealand Dollar accelerating toward support near 0.54 figure
The Australian Dollar was rejected downward after a brief recovery produced a test of trend line resistance in play since the beginning of the year, as expected. The subsequent collapse has breached lows set amid the 2008 global financial crisis, bringing the currency to its weakest in 18 years.
Prices are now testing support at 0.5567, the 100% Fibonacci expansion. Breaking below that with confirmation on a daily closing basis may set the stage for a challenge of the 0.5185-92 congestion area carved out between October 2000 and August 2002.
The 78.6% Fib at 0.5881 looks to be recast as immediate resistance in the event of a bounce. Recovering a foothold back above that might pave the way for a retest of the October 2008 low at 0.6009, followed by the 61.8% expansion at 0.6127.
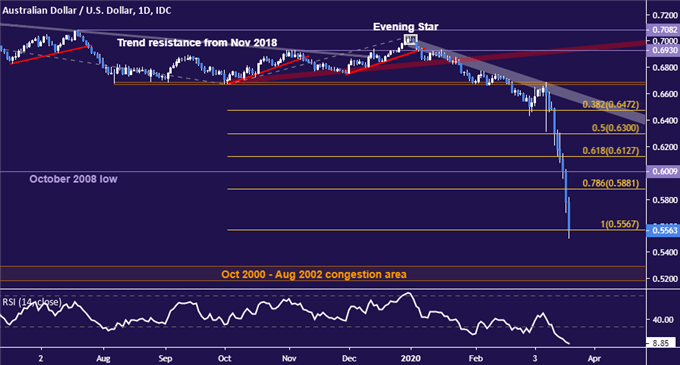
AUD/USD daily chart created with TradingView
The New Zealand Dollar has followed suit, overturning would-be signs of ebbing selling pressure. Prices are testing below the 78.6% Fibonacci expansion at 0.5691. A daily close below that may expose the 0.5327-0.5401 region. The prior crisis low at 0.4896 follows. Resistance begins at 0.5919, the 61.8% Fib.
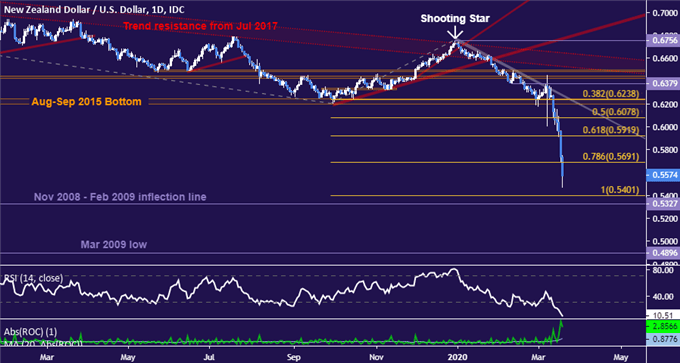
NZD/USD daily chart created with TradingView
FX TRADING RESOURCES
- Just getting started? See our beginners’ guide for FX traders
- Having trouble with your strategy? Here’s the #1 mistake that traders make
- Join a free live webinar and have your trading questions answered
--- Written by Ilya Spivak, Currency Strategist for DailyFX.com
To contact Ilya, use the comments section below or @IlyaSpivak on Twitter


