


AUD/USD TECHNICAL OUTLOOK: BEARISH
- Australian Dollar bounce may be ahead after prices hit an 11-year low
- Long-term chart positioning continues to argue for a bearish trend bias
- AUD/USD retail trader sentiment studies offer mixed directional cues
The Australian Dollar is consolidating after touching the lowest level in 11 years against its US counterpart. Prices fell conspicuously short of a confirmed break below six-month range support in the 0.6671-90 area and bounced to retest resistance guiding the descent in play since the beginning of the year.
Positive RSI divergence speaks to ebbing downside momentum, bolstering the case for an upswing. A daily close above 0.6755 seems likely to neutralize immediate selling pressure, setting the stage for a larger recovery. The 0.68 figure is in play thereafter.
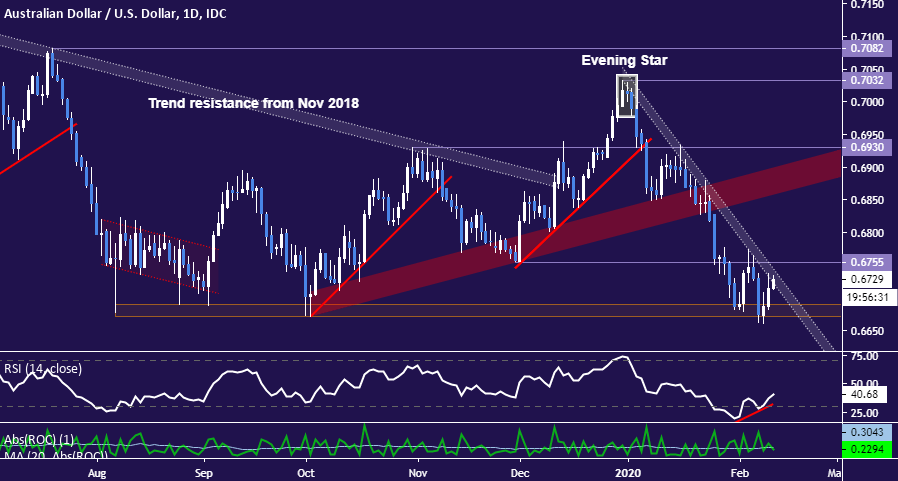
AUD/USD daily chart created with TradingView
Nevertheless, long-term positioning continues to telegraph a bearish bias. The monthly chart shows prices recoiled from support-turned-resistance in the 0.6900-0.7018 area, finishing January with the weakest close since March 2009.
That argues in favor of resuming the down move started in January 2018, which is itself a component of the structural decline from mid-2011 highs. In this scenario, the next layer of meaningful support begins at 0.6352. Extension lower to test that would imply a further 5-6 percent decline from current levels.
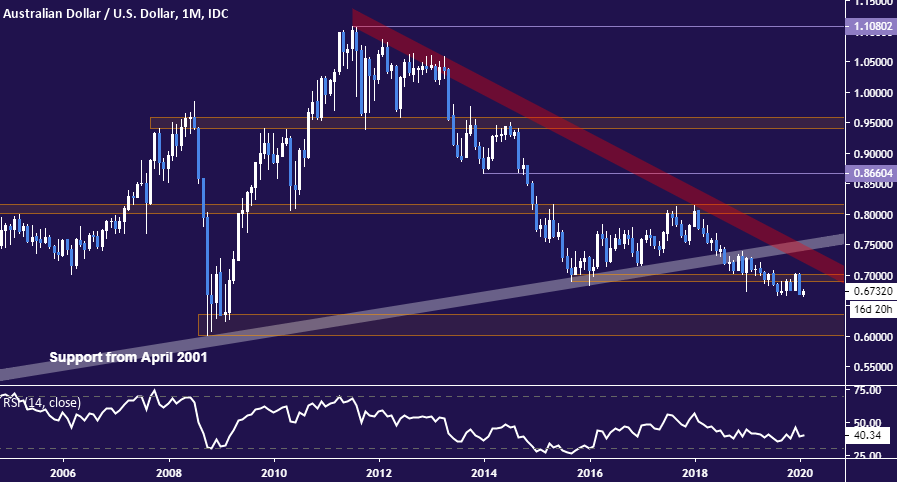
AUD/USD monthly chart created with TradingView
AUD/USD TRADER SENTIMENT

Retail trader data shows 77.79% of traders are net-long with the ratio of traders long to short at 3.50 to 1. The number of traders net-long is 0.91% higher than yesterday and 13.27% lower from last week, while the number of traders net-short is 11.73% lower than yesterday and 2.38% higher from last week.
IG Client Sentiment(IGCS) is typically used as a contrarian indicator, and the fact that traders are net-long suggests AUD/USD prices may continue to fall.Positioning is more net-long than yesterday but less soversus last week. Taken together, current sentiment and recent changes offer a mixed AUD/USD trading bias.
See the full IGCS sentiment report here.

AUD/USD TRADING RESOURCES
- Just getting started? See our beginners’ guide for FX traders
- Having trouble with your strategy? Here’s the #1 mistake that traders make
- Join a free live webinar and have your trading questions answered
--- Written by Ilya Spivak, Currency Strategist for DailyFX.com
To contact Ilya, use the comments section below or @IlyaSpivak on Twitter


