


Australian Dollar vs US Dollar Technical Outlook
- AUD/USD prints its lowest price in 2020
- AUD vs USD chart points out bearish signals yet a possible reversal
AUD/USD Price – Multi Month Low
On Friday, AUD/USD tumbled to its lowest level in nearly three months at 0.6682 , then closed the weekly candlestick in the red with 2.1% loss. This week, the price rallied as some shorts seemed to cover.
The relative Strength Index (RSI) fell from 40 to 31 indicating that bears were still in charge.
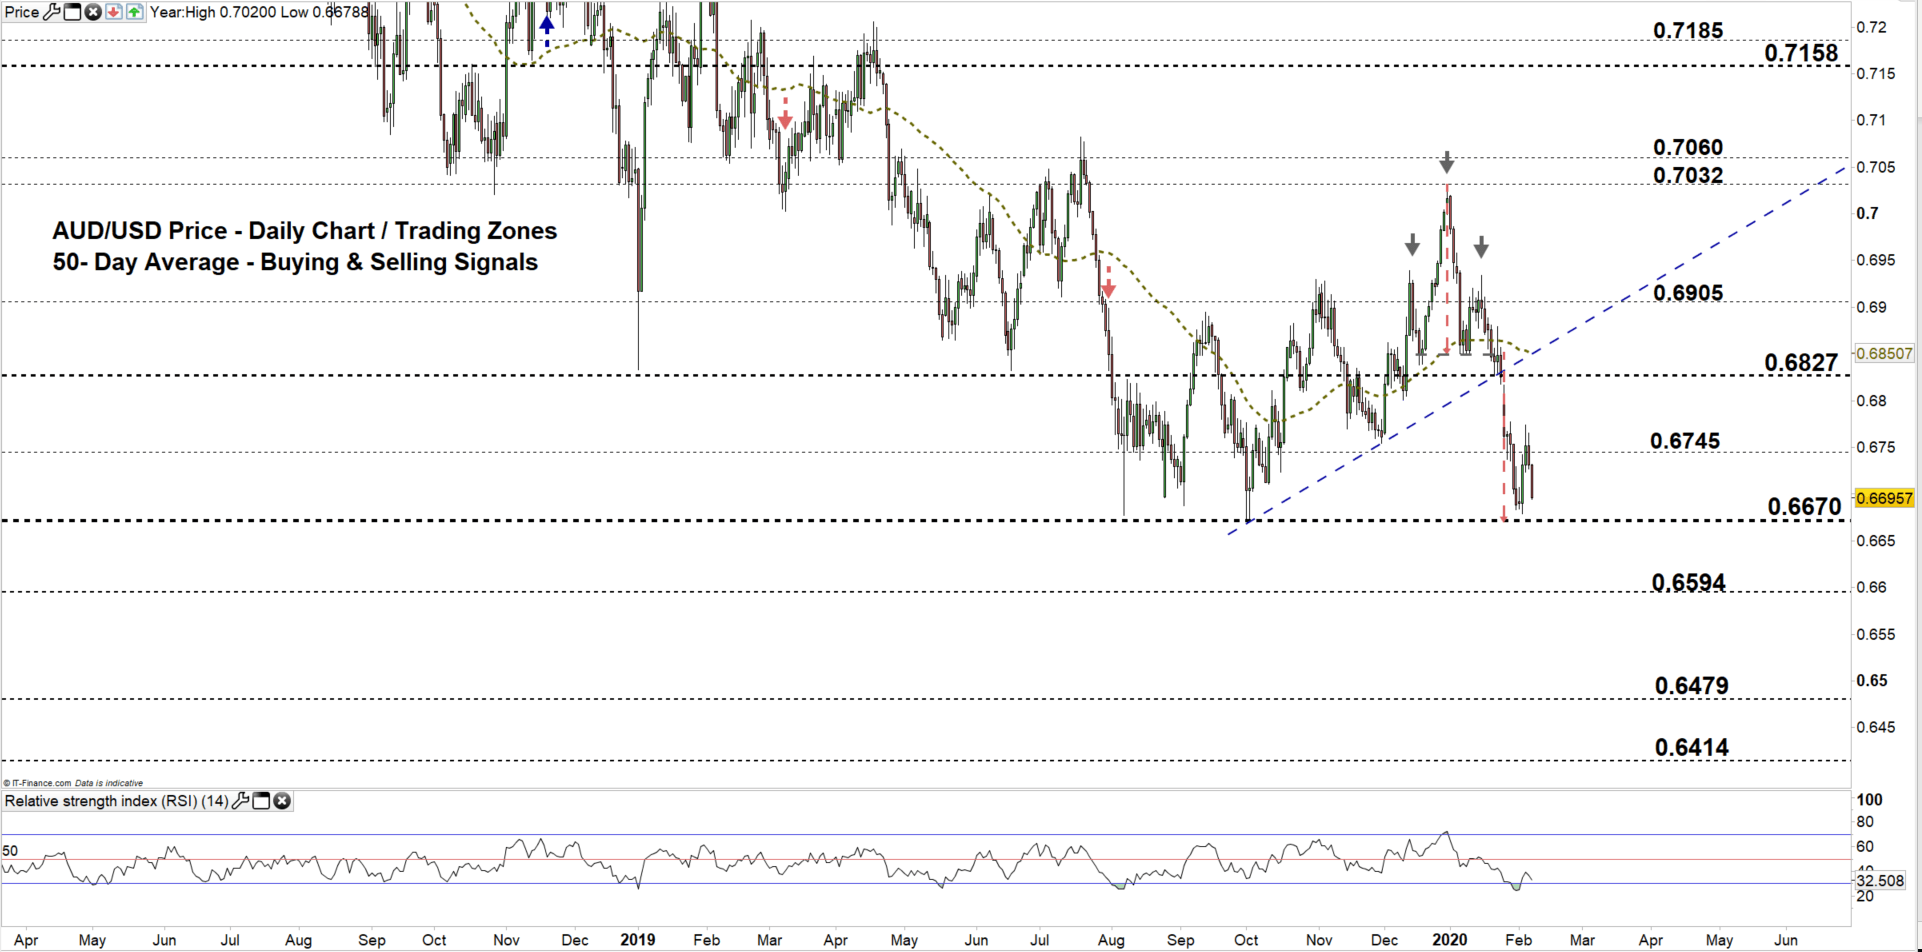
AUD/USD DAILY PRICE CHART (MAy 5, 2018 – FEB 7, 2020) Zoomed Out

AUD/USD DAILY PRICE CHART (SEP 12 – FEB 7, 2020) Zoomed IN

Looking at the daily chart, we notice that on Jan 21 AUD/USD closed below the 50-Day average generating a bearish signal. Three days later, the price broke below the uptrend line originated from the Oct 2 low at 0.6670 and violated the neckline of head and shoulders pattern discussed in our last update. See the chart (zoomed out).
Yesterday, the price reverted to a lower trading zone 0.6670 - 0.6745 eyeing a test of the low end of it. A close below the low end of the zone may embolden bears to press towards 0.6594. Further close below this level could mean more bearishness towards 0.6479. That said, the monthly support levels underlined on the chart (zoomed in) should be considered.
In turn, any failure in closing below the low-end of the zone highlights bears hesitation. This could lead some of them to exit the market and reverse the price’s direction towards the high end .

AUD/USD Four-Hour PRICE CHART (Jan 15 – FEB 7, 2020)

From the four- hour chart, we noticed on Jan 16 AUD/USD peaked at 0.6933 then started a downtrend move creating lower highs with lower lows. On Feb 5, the market corrected its move and carved out a higher high at 0.6774.
Its noteworthy that, AUDUSD could develop a double bottom pattern where the neckline resides at 0.6774. Any violation to the neckline may cause a rally towards 0.6866.
A break above 0.6777 could cause a rally towards 0.6810. Yet, the daily resistance level underlined on the chart should be kept in focus. On the other hand, a break below 0.6662 could send the AUDUSD towards 0.6605. Although, the monthly support level underlined on the chart should be watched closely.
Written By: Mahmoud Alkudsi
Please feel free to contact me on Twitter: @Malkudsi


