


AUD/USD TECHNICAL OUTLOOK: BEARISH
- Australian Dollar breaks support at 0.6811, exposing three-month floor
- Breaking that would suggest broader decline to decade lows in the cards
- Clear break above 0.69 needed to substantively check selling pressure
Get help building confidence in your AUD/USD strategy with our free trading guide!
The Australian Dollar extended lower after breaking support guiding the upswing from October lows, as expected. Sellers have now managed a decisive breach of support at 0.6811, seemingly opening the door to challenge the 0.6671-90 price floor in place since early August.
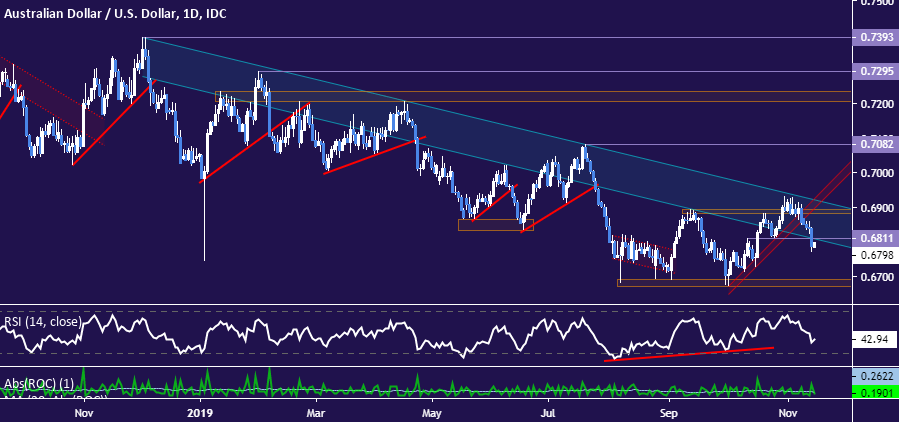
Daily AUD/USD chart created with TradingView
Moving beyond that would bolster the case for the monthly chart’s still-more bearish implications. It suggests that July’s breach of the 0.6900-0.7078 area broadly set the stage for slide toward decade lows in the 0.6009-0.6352 region. Clearing August lows would hint that the next leg in that process is underway.

Monthly AUD/USD chart created with TradingView
Looking back at the daily chart, a turn back above 0.6811 – now recast as resistance – would probably pave the way for a retest of the 0.69 figure. Establishing a firm foothold above threshold seems like a prerequisite for neutralizing near-term selling pressure.
AUD/USD TRADING RESOURCES
- Just getting started? See our beginners’ guide for FX traders
- Having trouble with your strategy? Here’s the #1 mistake that traders make
- Join a free live webinar and have your trading questions answered
--- Written by Ilya Spivak, Currency Strategist for DailyFX.com
To contact Ilya, use the comments section below or @IlyaSpivak on Twitter


