


AUD/USD Technical Analysis
- Australian Dollar price action against US Dollar
- AUD/USD Charts and analysis
Did we get it right with our Gold and USD Dollar forecasts? Find out more for free from Q4 main currencies and commodities forecasts
AUD/USD – Bullish Development
On Oct 25, AUD/USD U-turned then rallied this week to 0.6929- its highest level in over three months.
Alongside this, the relative Strength Index (RSI) rose from 53 to 66 highlighting the strength of uptrend impulse.
Having trouble with your trading strategy? Here’s the #1 Mistake That Traders Make
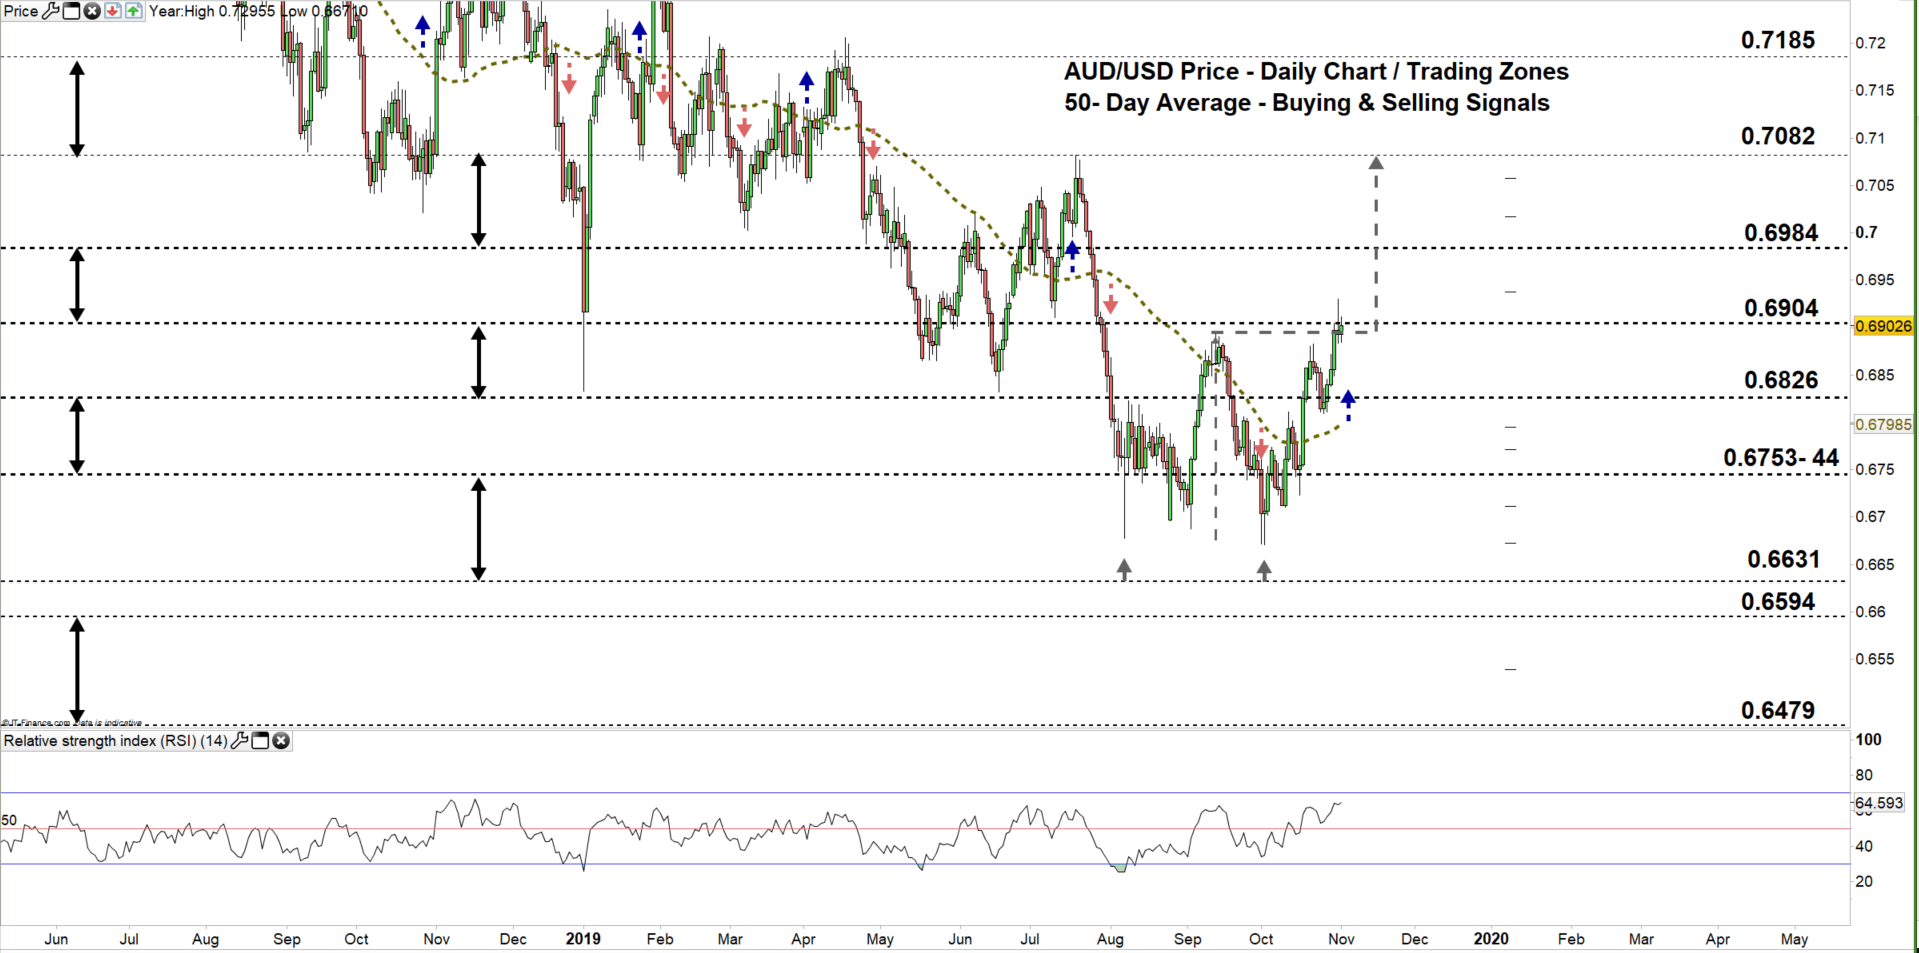
AUD/USD DAILY PRICE CHART (JUNE 15, 2018 – Nov 1, 2019) Zoomed Out
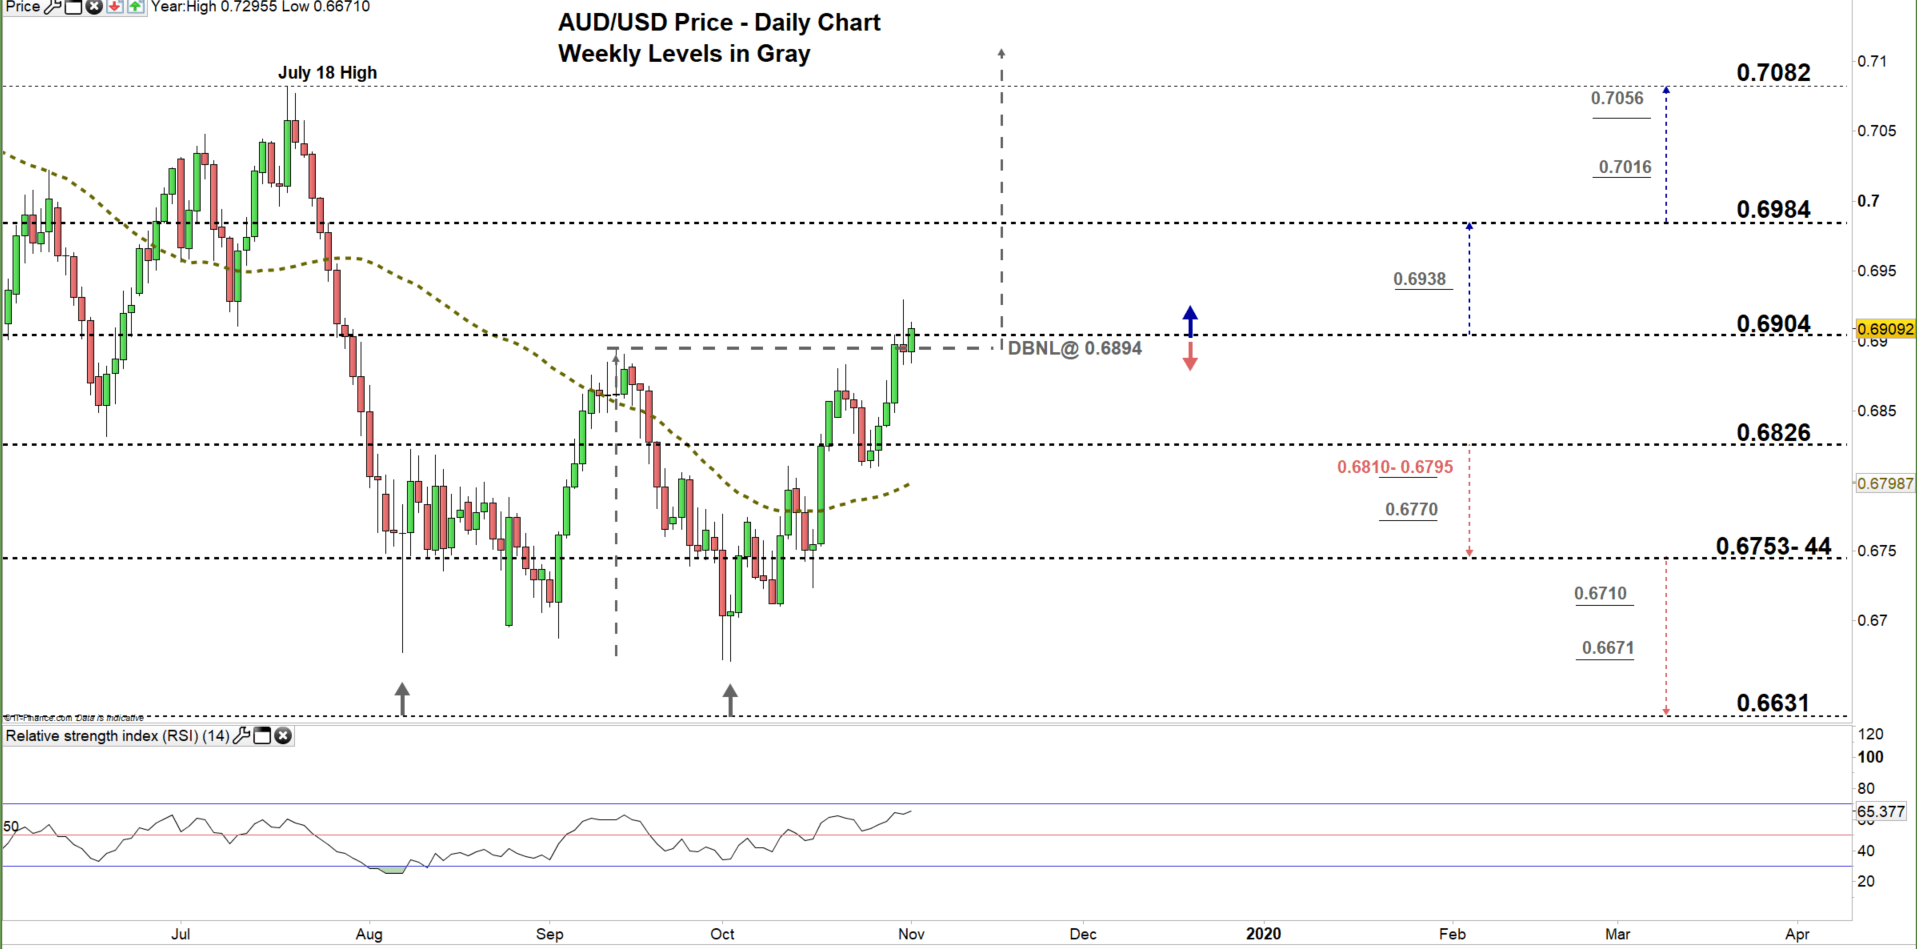
AUD/USD DAILY PRICE CHART (May 31 – NOv 1, 2019) Zoomed IN
Looking at the daily chart, we notice yesterday AUD/USD tested moving to a higher trading zone however, the pair failed and reverted to the old trading zone 0.6826 – 0.6904, highlighting buyer’s hesitation to continue rallying the price.
Thus, another failure in closing above the high end of the zone could embolden sellers to send the price for a test of the low end of the zone. Further close below the low end could see AUDUSD trading even lower towards 0.6631. However, the daily and weekly support area and levels marked on the chart (zoomed in) should be considered.
On the other hand, a successful close above the high end of the zone could see AUDUSD trading towards 0.6984. Additionally, it would keep the price above the neckline of the double bottom pattern located at 0.6894.
This suggests the pair could rally towards 0.7000 handle and above, as long as stays above the neckline. That said, the weekly resistance levels underlined on the chart should be kept in focus.
Just getting started? See our Beginners’ Guide for FX traders
AUD/USD Four-Hour PRICE CHART (Sep 13 – Nov 1, 2019)
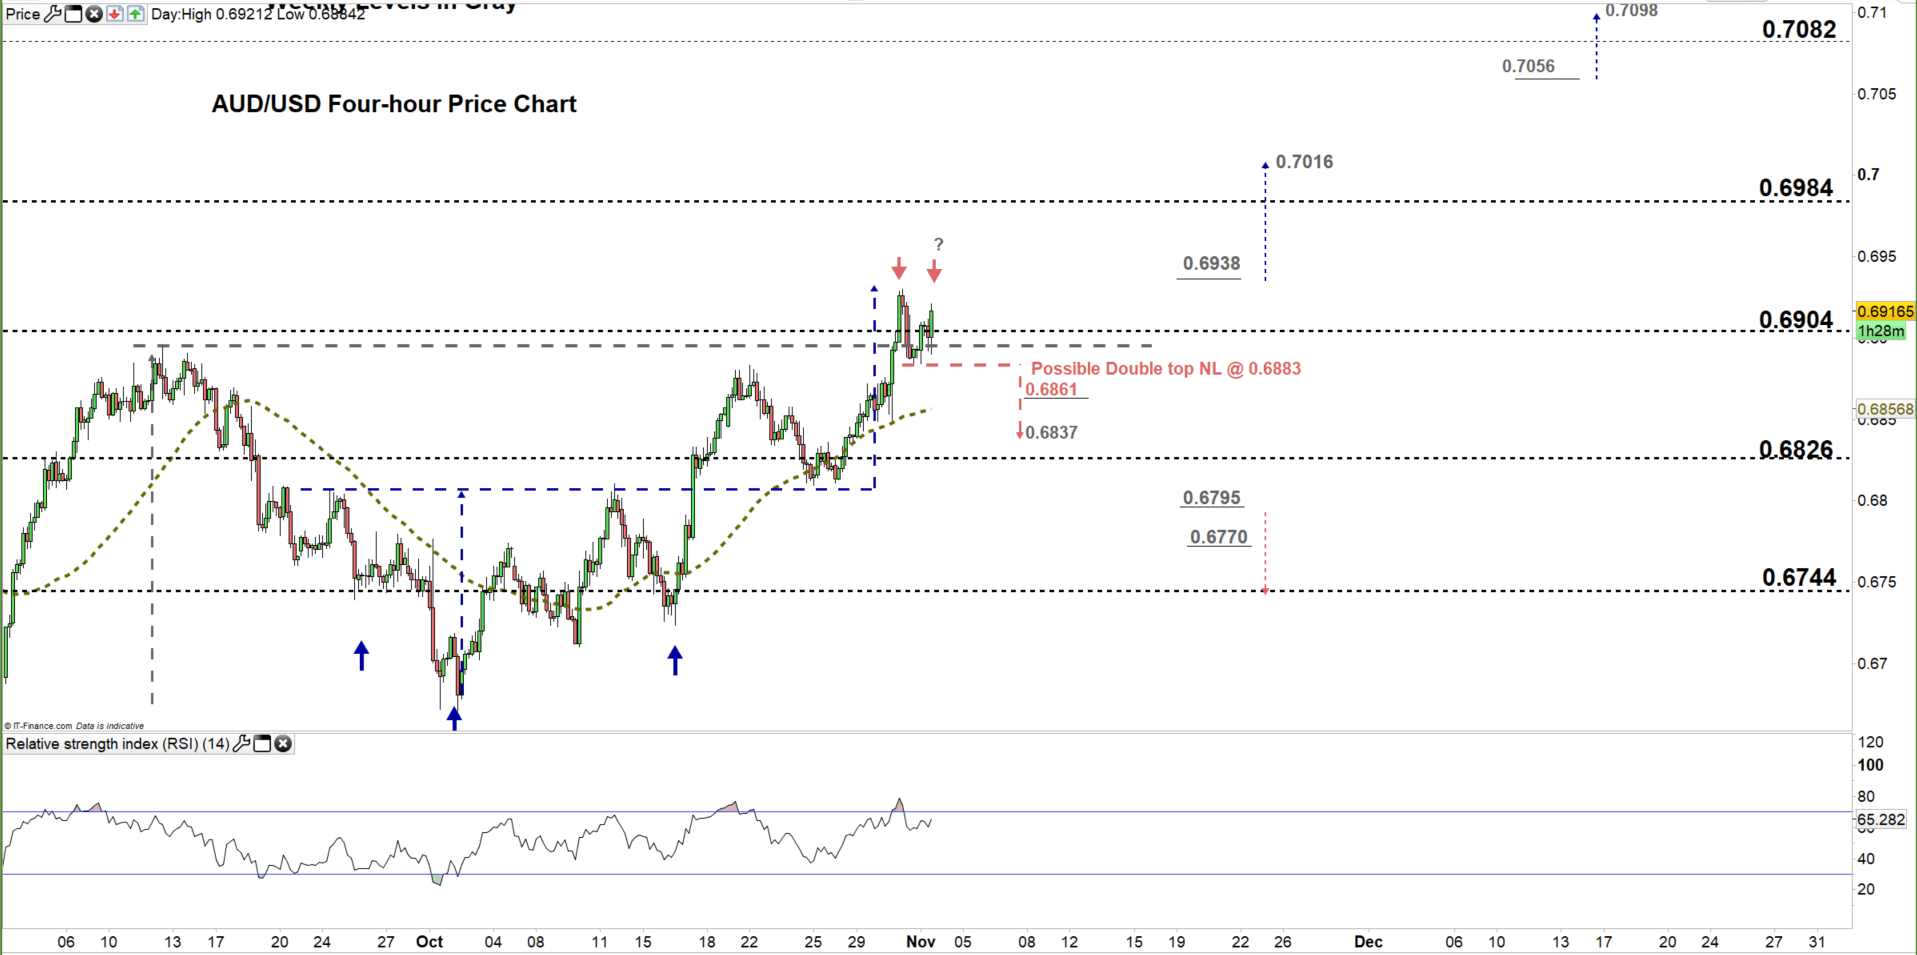
From the four- hour chart, we notice on Oct 17 AUD/USD broke above the neckline of inverted head and shoulders discussed in our article: AUU/USD outlook May shift to bullish
At the end of Oct, AUDUSD rallied above 0.6900 handle for its first time in over three months. The pair could continue its rally if breaks above 0.6938. In that scenario, the price could rally towards 0.7016 contingent on clearing the end of higher trading zone located at 0.6984.
On the flip-side, the price could correct lower if break and remains below the neckline of possible double top pattern located at 0.6883. This suggests AUDUSD could decline towards 0.6837. However, the daily support underscored on the chart should be monitored.
See the chart to know more about key levels to monitor in a further bullish/bearish move.
Written By: Mahmoud Alkudsi
Please feel free to contact me on Twitter: @Malkudsi


