


AUD/USD TECHNICAL OUTLOOK: BEARISH
- AUD may retest near 0.69 after completing bullish Flag pattern
- Overall price direction continues to favor a broadly bearish bias
- Counter-trend line break needed for actionable short-side setup
Get help building confidence in your AUD/USD strategy with our free trading guide!
The Australian Dollar may move up to retest the 0.69 figure against its US counterpart before the broader downward trend resumes in earnest. Prices rebounded after testing resistance-turned-support at 0.6811, completing a bullish Flag chart pattern (as suspected last week).
Initial resistance is marked by the 23.6% Fibonacci expansion at 0.6856. A break above that opens the door for a test of the 0.6886-95 area marking the to of the range confining trade since mid-September. This barrier is reinforced by the 38.2% level at 0.6887.
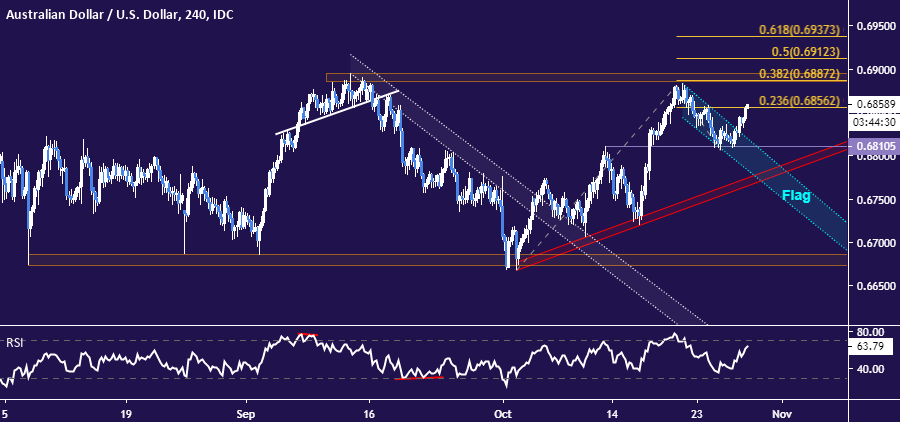
4-hour AUD/USD chart created with TradingView
Turning to the daily chart for a broader picture suggests the dominant trend bias still looks decidedly bearish however. AUD/USD remains capped by resistance leading it lower since early December 2018. A daily close above that level – now at 0.6946 – is needed to convincingly neutralize selling pressure.

Daily AUD/USD chart created with TradingView
In this context, any near-term gains look likely to be corrective (at least for now), offering a potential opportunity to establish shorts relatively more attractive levels. An actionable trade setup probably requires bearish resumption confirmation on a close below counter-trend support set from October lows.
AUD/USD TRADING RESOURCES
- Just getting started? See our beginners’ guide for FX traders
- Having trouble with your strategy? Here’s the #1 mistake that traders make
- Join a free live webinar and have your trading questions answered
--- Written by Ilya Spivak, Currency Strategist for DailyFX.com
To contact Ilya, use the comments section below or @IlyaSpivak on Twitter


