


Australian Dollar Technical Analysis - Talking Points
- Australian Dollar under pressure at March 2009 lows again
- Clearing support exposes August lows, dominant downtrend
- Near-term AUD/USD signals hint a turn higher may be due
Build confidence in your own Australian Dollar trading strategy with the help of our free guide!
AUD/USD Technical Outlook
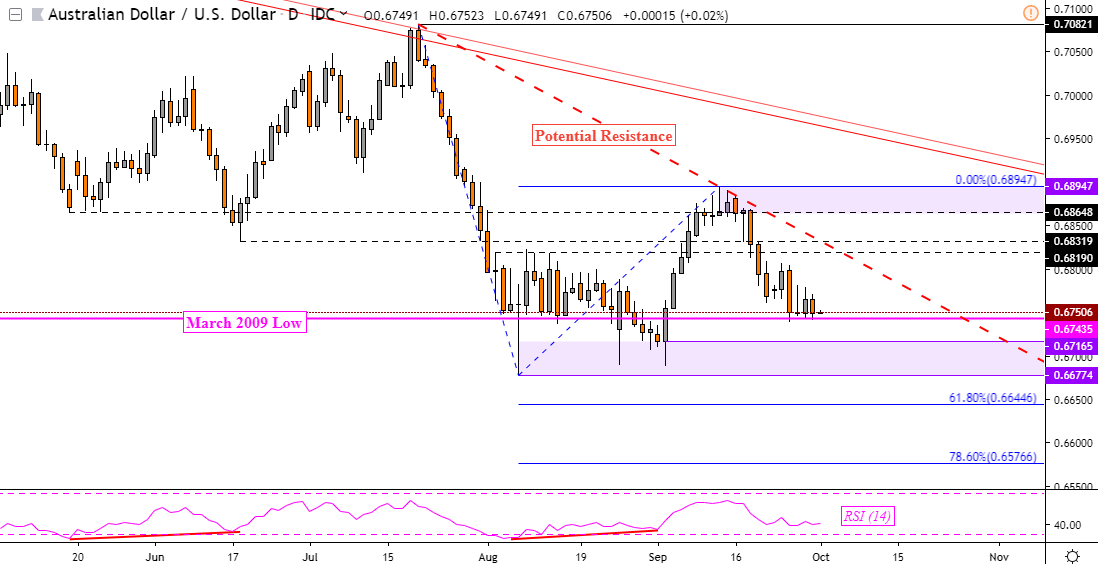
The Australian Dollar is finding itself under pressure against the US Dollar as it attempts to push through the March 2009 low again. This is ahead of the October Reserve Bank of Australia interest rate announcement, which could produce monetary-policy-based volatility in the currency as markets widely anticipate a cut. Will support hold?
On the daily chart, AUD/USD has been in a near-term downtrend since the latter half of September. This has left behind what could be potential descending resistance from July – red dashed line below. In the event of a turn higher ahead, overcoming its descent would likely entail clearing this trend line. That would then expose September highs which are a range between 0.6865 and 0.6895.
On the other hand, diving through 0.6744 would offer AUD/USD another chance of resuming the dominant downtrend that has prevailed since 2018. Doing so would entail closing under the key support area between 0.6717 and 0.6678. That would then expose the 61.80 percent Fibonacci extension at 0.6645 followed by the 78.60% level at 0.6577.
AUD/USD Daily Chart
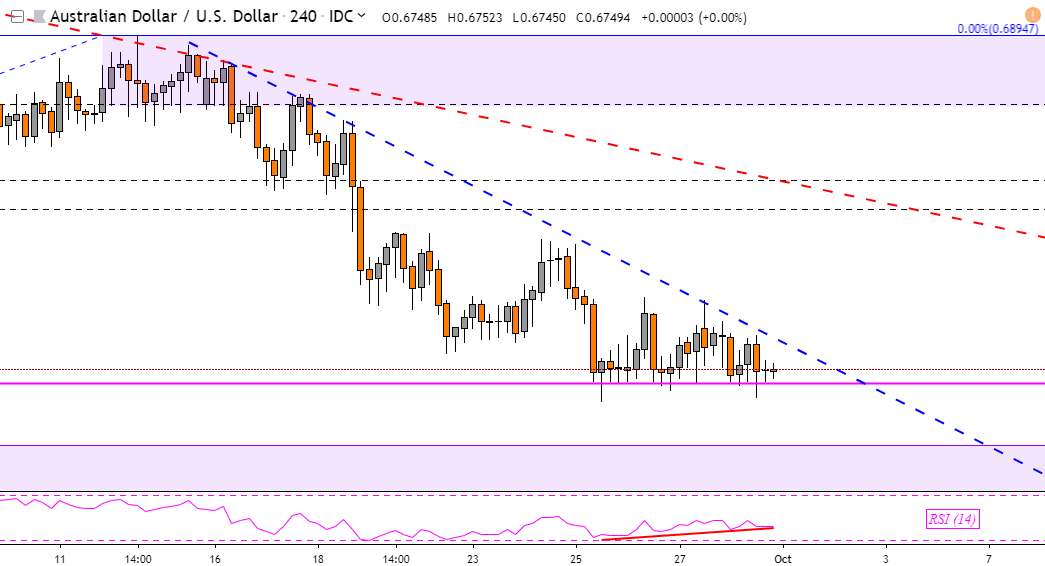
Zooming in on the 4-hour chart does reveal positive RSI divergence around the March 2009 low. This is a sig of fading downside momentum and could translate into a turn higher. In such an outcome, keep an eye on short-term descending resistance from September 15 – blue dashed line below. That would open the door to a test of the falling trend line from July.
AUD/USD 4-Hour Chart
Australian Dollar ChartsCreated in TradingView
FX Trading Resources
- Having trouble with your strategy? Here’s the #1 mistake that traders make
- See how the Australian Dollar is viewed by the trading community at the DailyFX Sentiment Page
- Just getting started? See our beginners’ guide for FX traders
--- Written by Daniel Dubrovsky, Currency Analyst for DailyFX.com
To contact Daniel, use the comments section below or @ddubrovskyFX on Twitter


