


AUD/USD TECHNICAL OUTLOOK: BEARISH
- Australian Dollar slips below range support en route below 0.67 figure
- Cautious price action warns against over-extrapolating follow-through
- Long term chart setup warns prices may shed at least 5-6 percent more
Get help building confidence in your AUD/USD strategy with our free trading guide!
The Australian Dollar seems to have finally breached support at the bottom of a choppy range marked by the January 2019 spike low at 0.6744. Prices gapped under this threshold at the start of the week but an intraday recovery deferred breakdown confirmation. Now, a clear-cut close under support seems to have set the stage to challenge the August 7 low at 0.6677.
Sellers are proceeding cautiously however, managing but a narrow slip below support rather than an explosive crash through it. False breakout risk seems higher in this environment compared to that alternative, calling for caution in extrapolating follow-through. A move back above 0.6744 – now recast as resistance – puts another former support in the 0.6824-65 area into focus.
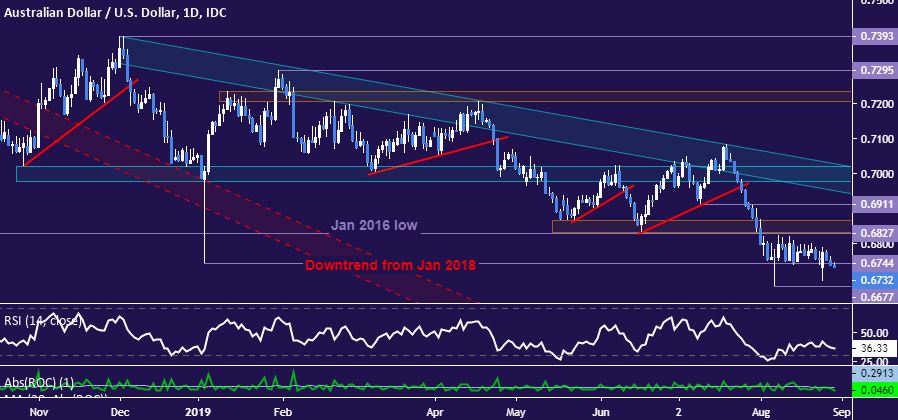
AUD/USD chart created with TradingView
The bearish tilt in longer-term positioning seems far less timid. AUD/USD looks to have followed the break of rising trend support guiding it higher for nearly two decades with a push though a four-year support shelf in the 0.6900-0.7018 support shelf. The next meaningful downside hurdle lines up in the 0.6009-0.6352 zone, initially implying room for prices to shed a further 5-6 percent in the days and weeks ahead.
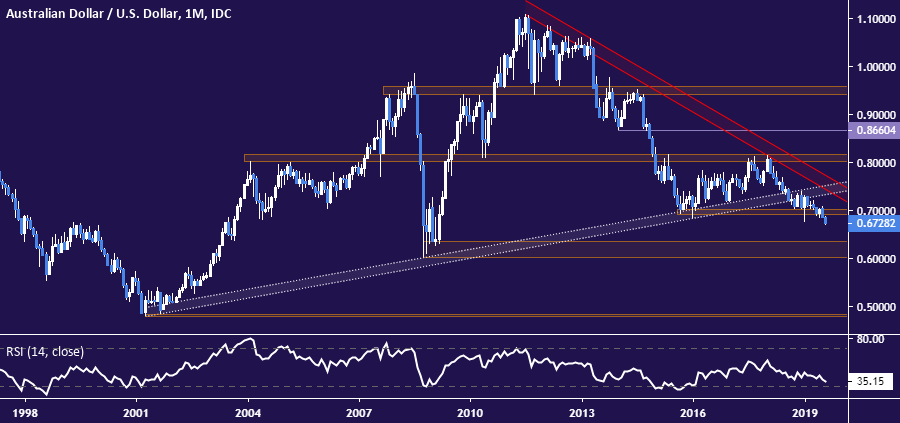
AUD/USD chart created with TradingView
AUD/USD TRADING RESOURCES
- Just getting started? See our beginners’ guide for FX traders
- Having trouble with your strategy? Here’s the #1 mistake that traders make
- Join a free live webinar and have your trading questions answered
--- Written by Ilya Spivak, Currency Strategist for DailyFX.com
To contact Ilya, use the comments section below or @IlyaSpivak on Twitter


