AUD/USD TECHNICAL OUTLOOK: BEARISH
- Australian Dollar idling near 2019 low against US counterpart
- Long-term chart setup flags room for substantially deeper drop
- Invalidation point for near-term bearish bias now above 0.70
Get help building confidence in your AUD/USD strategy with our free trading guide!
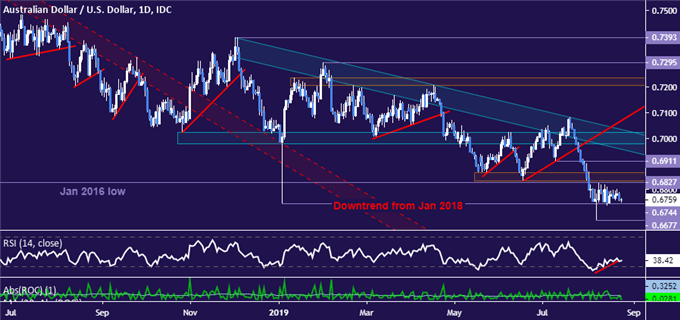
The Australian Dollar continues to idle above support marked by the 2019 swing low at 0.6827 as traders struggle to establish conviction. A break downward confirmed on a daily closing basis initially opens the door to challenge the August 7 swing low at 0.6677.
Resistance stands in the 0.6827-65 area, a former support shelf. A turn back above that faces a minor barrier at 0.6911, the July 10 low. Neutralizing the broadly bearish bias in overall positioning probably requires a close above trend resistance set from December 2018, now at 0.7033.

AUD/USD chart created with TradingView
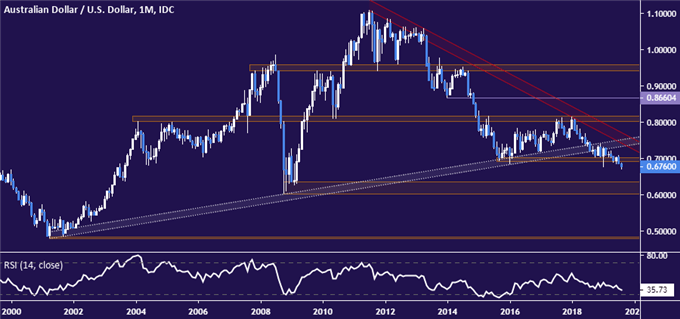
Zooming out to the monthly chart for a bit of perspective is a useful exercise amid choppy near-term price action. Here we see prices have breached the bounds of an 18-year rising trend as well as a support block capping downside progress since September 2015.
The implications appear to be quite dire. Not only has the structural trend seemingly shifted to point downward, but the next layer of significant support looks to be some ways away, starting at 0.6352. That speaks to space for a further depreciation in excess of 6 percent in the months ahead.

AUD/USD chart created with TradingView
AUD/USD TRADING RESOURCES
- Just getting started? See our beginners’ guide for FX traders
- Having trouble with your strategy? Here’s the #1 mistake that traders make
- Join a free live webinar and have your trading questions answered
--- Written by Ilya Spivak, Currency Strategist for DailyFX.com
To contact Ilya, use the comments section below or @IlyaSpivak on Twitter


