


AUDUSD CHART ANALYSIS: BEARISH
- Australian Dollar bounce seen as corrective within broader downtrend
- Invalidating bearish bias needs a breach of resistance above 0.71 figure
- Weekly chart positioning implies downside objective near the 0.67 mark
Get help building confidence in your AUDUSD strategy with our free trading guide!
The Australian Dollar has managed a tepid recovery against its US counterpart after finding support just above the January 2016 low at 0.6827. Still, the outlines of the breakdown identified last week – a breach of countertrend support following rejection former resistance in the 0.6978-0.7021 area – remain intact.
That paints the current rise as corrective within the context of a larger descent. In fact, buyers would probably need to engineer a daily AUDUSD close above falling trend line resistance set from early December 2018 – now at 0.7114 – to convincingly neutralize the downside bias.
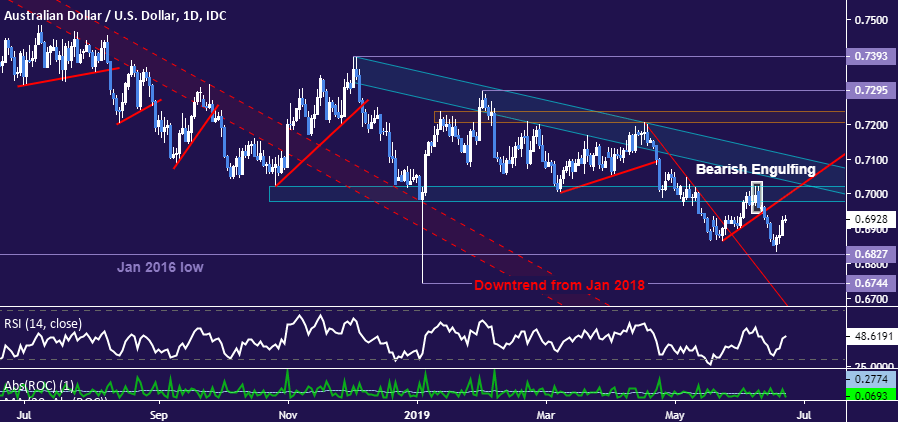
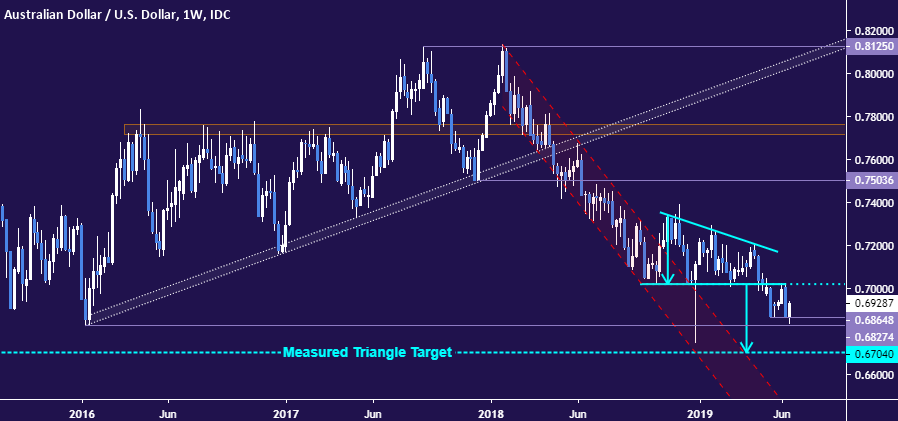
Bearish resumption that brings the exchange rate below 0.6827 targets the 2019 spike low at 0.6744 next. The weekly chart warns of deeper losses still, showing a completed Descending Triangle chart formation that implies a measured downside target within a hair of the 0.67 figure.
AUDUSD TRADING RESOURCES
- Just getting started? See our beginners’ guide for FX traders
- Having trouble with your strategy? Here’s the #1 mistake that traders make
- Join a free live webinar and have your trading questions answered
--- Written by Ilya Spivak, Currency Strategist for DailyFX.com
To contact Ilya, use the comments section below or @IlyaSpivak on Twitter


