


To receive Ilya's analysis directly via email, please SIGN UP HERE
Talking Points:
- AUD/USD Technical Strategy: Flat
- Support:0.7751, 0.7623, 0.7416
- Resistance:0.7855, 0.7959, 0.8031
The Australian Dollar resumed moving lower against its US counterpart, issuing the largest daily decline in three months. A daily close below the 61.8% Fibonacci expansion at 0.7751 exposes the 76.4% level at 0.7623. Alternatively, a reversal above the 50% Fibat 0.7855opens the door for a test of the 38.2% expansion at 0.7959.
Risk/reward considerations argue against entering short with prices in close proximity to support. On the other hand, the absence of a defined bullish reversal signal suggests taking up the short side is premature. We will remain flat for now, waiting for a more actionable opportunity to present itself.
Add these technical levels directly to your charts with our Support/Resistance Wizard app!
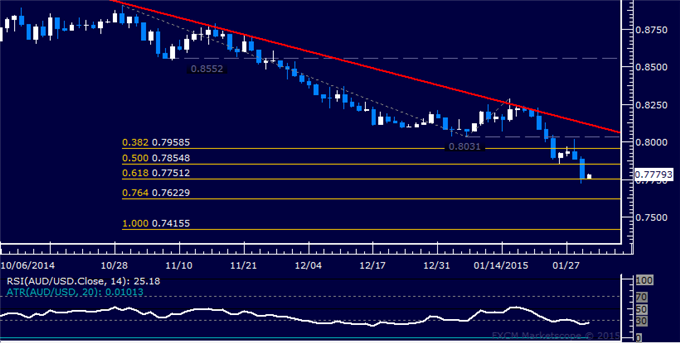
Daily Chart - Created Using FXCM Marketscope
--- Written by Ilya Spivak, Currency Strategist for DailyFX.com


