


Talking Points:
- ASX 200 Strategy: Keep tight stops nearby resistance, or position for break or failure
- Mixed signals: uptrend in moving averages, downward momentum
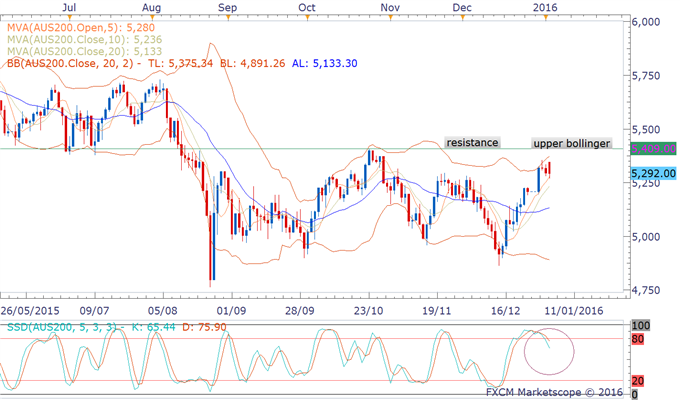
- Resistance levels:Upper Bollinger at 5375, past daily high at 5409
The ASX 200 is testing upper Bollinger band at 5375 and a resistance level at 5409 for the second time since October 2015. However RSI momentum signals indicate a downturn is building. It will therefore be a tough contest for the index, where a failure to break would create a double top.
Upper Bollinger band has effectively capped upward price moves during the last year, hence it is not an easy one to break. On top of that, past daily high and resistance level at 5409 has contained the topside of price action since a regional stock rout in August. They make for a tough resistance region, where a successful attempt will see ASX 200 returning to the 5500-6000 area.
Range traders could keep their stops tight in case of a break. On the other hand, moving averages indicate an uptrend signal and trend traders may consider long position in the event of a break. These mixed signals call for cautious trading tactic, especially as stock markets remain thin at this early in the year.
Losing Money Trading Forex? This Might Be Why.
--- Written by Nathalie Huynh, Strategist for DailyFX.com
Contact and follow Nathalie on Twitter: @nathuynh


