


The Elliott Wave chart pattern for USDJPY appears to have carved an impulse to start a new trend. After a minor dip, we are anticipating another push higher towards 108.
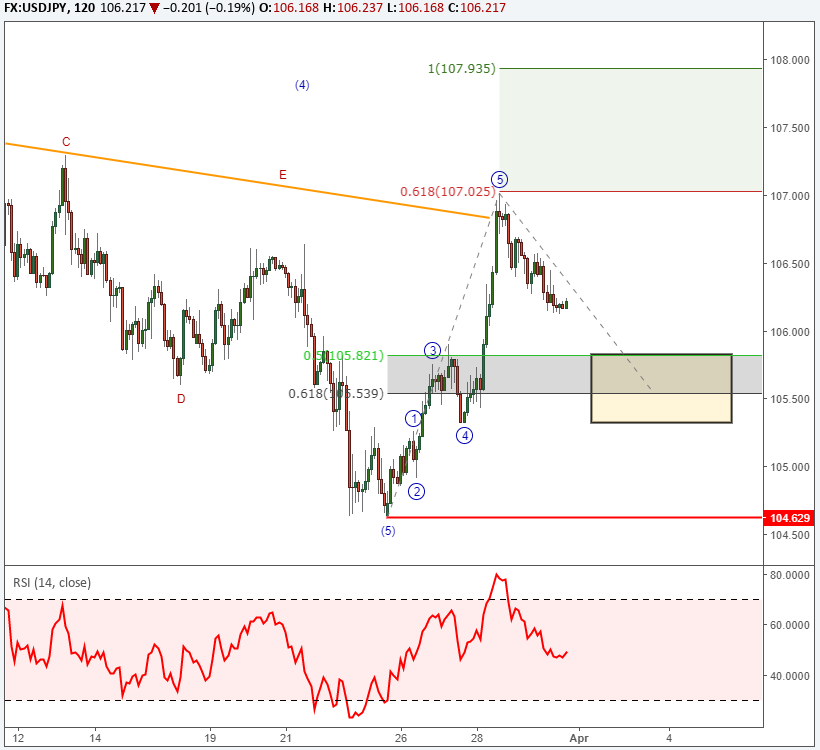
We have been tracking a pattern on the USDJPY chart that suggests a meaningful low forming in the 103-105 vicinity. The March 25 low did reach 104.63 so the higher probability move is towards higher levels. In Monday’s US Opening Bell webinar, we highlighted the possibility of USDJPY reaching 106.50 to 108 resulting from hitting channel support.
Since then, USDJPY as ascended to 107.01 so what is next for the market? Using Elliott Wave Theory, we can count a five-wave impulse forming from the 104.63 low. Within this impulse, the fifth wave appears extended. As a result, it would be normal for USDJPY to experience a pull back towards 105.30 to 105.80. At that point, we would look for symptoms of a bullish reversal that may press higher towards 108.
How did Elliott Wave Theory help us identify the reversal zone on USDJPY Chart?
A couple wave relationships appear in this 105.30 to 105.80 price zone. According to Elliott Wave Theory, an impulse wave that starts a new trend is typically followed by a partial retracement. Using Fibonacci retracement levels the 50-61% retracement zone arrives near 105.50-105.80.
Secondly, within an impulse wave that contains an extended fifth wave, many times the subsequent retracement moves back to the second wave of the extended fifth wave. That price point is near 105.40.
Lastly, it is common for the previous fourth wave to provide support in an ensuing retracement. The previous fourth wave yields 105.30-105.75.
Elliott Wave Forecast for USDJPY
Since the USDJPY chart shows an impulse wave to start a new trend, we think that after a partial retracement to the 105.30-105.80 zone, USDJPY may grind higher towards 108. This Elliott Wave forecast is valid so long as USDJPY remains above 104.63.
If USDJPY breaks below 104.63, then we will need to consider another pattern is in the works.
USDJPY Sentiment is Bearish
IG Client Sentiment shows the number of traders have been steadily net long over the past couple of months. This bearish signal implies additional losses in the future. Therefore, our bullish target is kept to a conservative mark near 108. View how live traders are positioned with our IG client sentiment tool.
Elliott Wave Theory FAQs
What is Elliott Wave Theory?
Elliott Wave Theory was developed by Ralph Nelson Elliott back in the 1930’s. It is a study of wave cycles and patterns. Five waves define the direction of the trend and three waves define a corrective move. Review our beginners and advanced Elliott Wave guides to learn more about the terms, rules, and common patterns of Elliott Wave principle.
After reviewing the guides, be sure to follow future Elliott Wave articles to see Elliott Wave Theory in action.
Can a newer trader learn and understand Elliott Wave Theory?
Just like learning to ride a bicycle, we all started as beginners at one time or another. I would first suggest familiarizing yourself with FX terminology and how to read a currency quote, and then read the Traits of Successful traders to understand the habits of successful traders. Therefore, regardless of the analytical method, you have a foundation for trading to build a strategy.
---Written by Jeremy Wagner, CEWA-M
Jeremy Wagner is a Certified Elliott Wave Analyst with a Master’s designation. These articles are designed to illustrate Elliott Wave applied to the current market environment. See Jeremy’s bio page for recent Elliott Wave articles.
Communicate with Jeremy and have your shout below by posting in the comments area. Feel free to include your Elliott Wave count as well.
Discuss this market with Jeremy in Monday’s US Opening Bell webinar.
Follow on twitter @JWagnerFXTrader .
Join Jeremy’s distribution list.


