


Elliott Wave Talking Points:
- Weekly Crude oil chart shows price near a common reversal point
- Anticipating a bearish reversal to retrace a significant portion of the 2016-2018 up trend
- Bonus chart of a Natural Gas forecast as a meaningful low may be forming soon
The crude oil Elliott Wave analysis on the weekly price chart shows a bearish pivot may be occurring near current levels to retrace a significant portion of the previous uptrend. Nat Gas prices may be approaching a significant bullish turning point too.
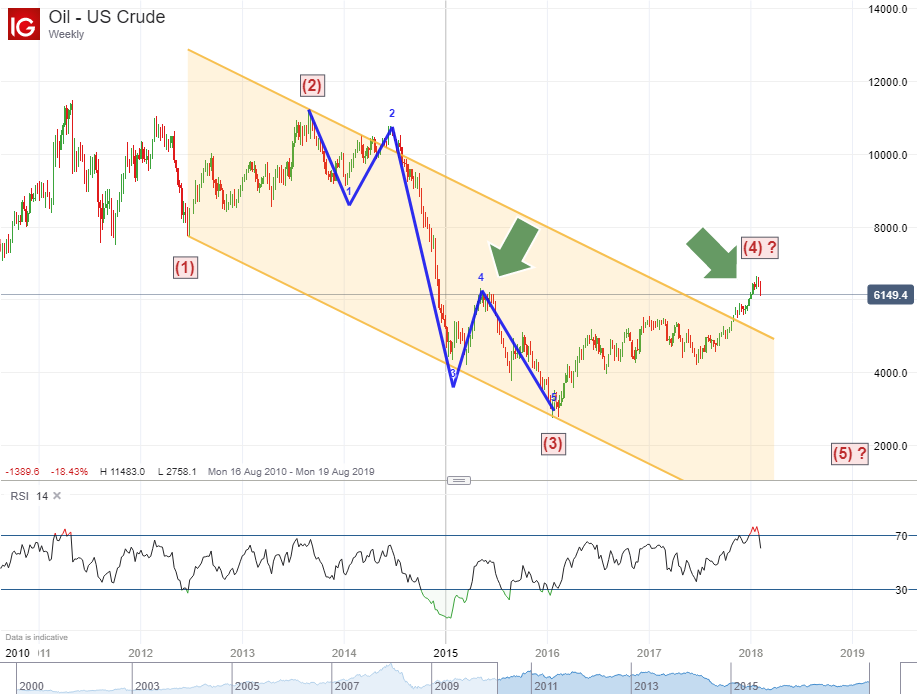
Within an Elliott Wave impulse wave, many times the fourth wave will retrace to the price extreme of the previous fourth wave at smaller degree of trend. For crude oil, the previous fourth wave was June 2015 near $62. Crude has temporarily popped above this level suggesting that current uptrend is mature in both time and price (see the green arrows on the weekly chart below).
We can also anticipate a termination point in the fourth wave of an impulse by drawing a trend line connecting the end of waves one and three. Then, duplicate that line and place it at the end of wave two of that impulse. Many times, the fourth wave will slightly surpass the trend channel line.
Crude oil prices have been holding above this line for the past month. According to the Elliott Wave principle, the crude oil forecast is bearish for the remainder of 2018.
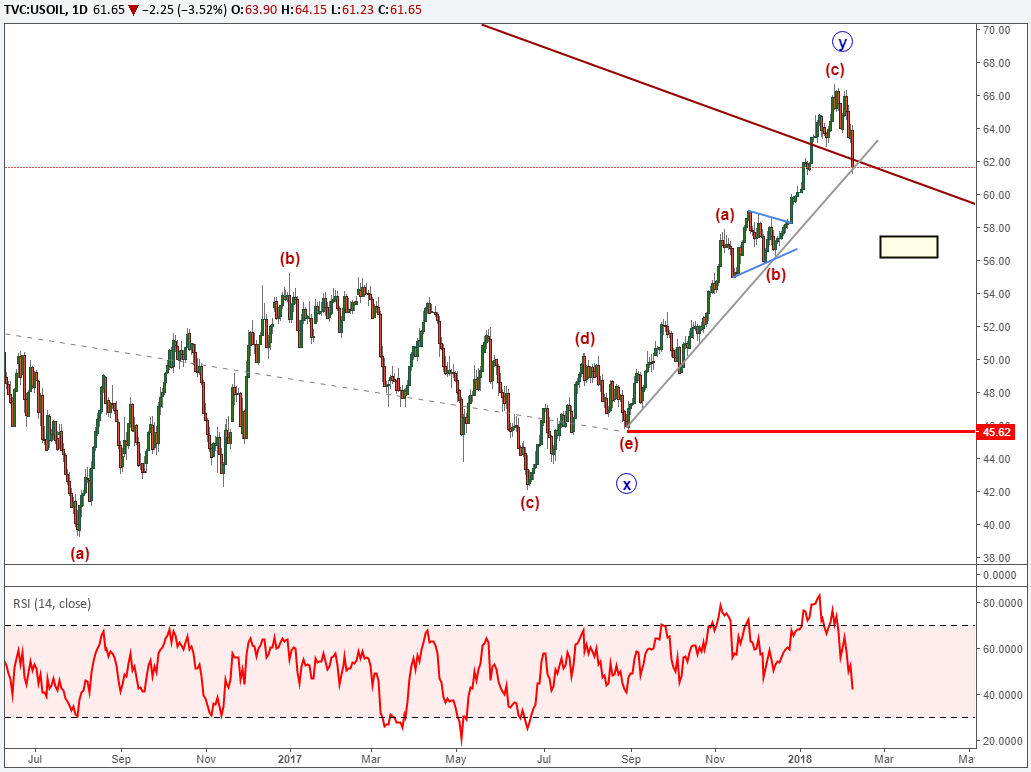
Dialing into a daily chart, we can count the minimum waves necessary for wave (4) to be complete. Our Elliott Wave analysis projects this fourth wave as a W-X-Y double zigzag combination. This fourth wave appears very mature and may be complete already. Crude oil prices are starting to break below the grey support trend line that is acting like an early warning signal for bears.
A successful break of the trend line opens the door for losses to $56-$58, though greater potential exists. The fifth wave of the impulse may drive crude oil to retrace most of the 2016-2018 up trend targeting below $40 and possibly $25 per barrel.
Bonus Chart - Nat Gas Elliott Wave Forecast Hints a Bottom Forming Soon
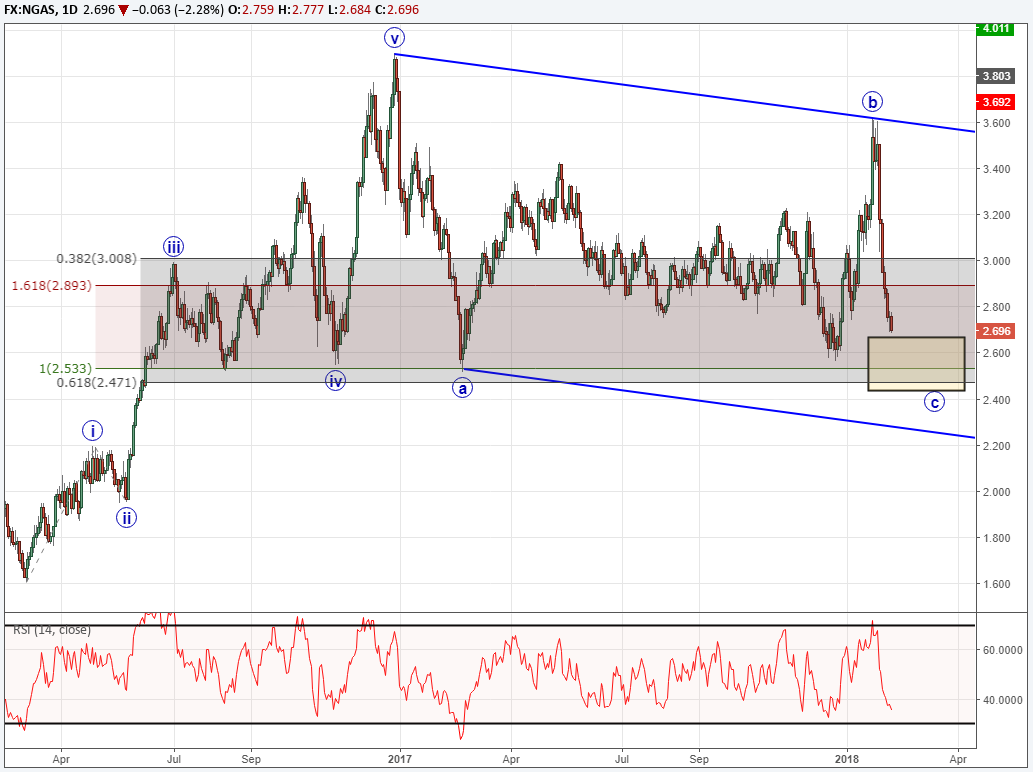
We wrote back in September 2017 that a dip towards 2.60 might offer Nat Gas bulls an opportunity to establish long positions. Nat Gas prices have been selling off hard and we think this may be a flush out prior to opening the door for bulls.
There are several wave relationships appearing near this 2.60 price level. For example, the pattern since December 2016 appears to be a flat pattern. This implies we might see a false break of the February 2017 low prior to a meaningful low forming. We anticipate this low to form near fourth wave of the previous impulse wave as that is a common retracement area.
In some scenarios where a zone has been identified, I will wait for a bullish Elliott Wave sequence to unfold or look to trade a bullish breakout on a smaller time framed chart.
Elliott Wave Theory FAQs
What markets is Elliott Wave Theory best applied?
Elliott Wave Theory is best applied to the liquid markets. Therefore, you will see me apply my analysis to major and common FX pairs, stock indices, common commodities like gold, silver, copper, and energy like oil or natural gas.
If you are not sure if Elliott Wave is for you, consider reading some materials that will help you get started in trading FX with some commentary on the habits that make successful traders.
“The Elliott Wave principle seems subjective!”
Well, I would disagree, as the EWP rules are not broken. The challenge is most likely the result of forecasting error. Even I make forecasting mistakes and it happens to everyone as we are assessing a live market environment. One key for budding Elliott Wave technicians is to learn the main patterns, and then minimize those errors by following the larger trend. We discuss this and other expert tips in our beginners and advanced trading guides.
---Written by Jeremy Wagner, CEWA-M
Jeremy is a Certified Elliott Wave Analyst with a Master’s designation. These articles are designed to show Elliott Wave analysis in the live market environment for educational purposes. Read more of Jeremy’s Elliott Wave reports via his bio page.
Follow on twitter @JWagnerFXTrader .
Join Jeremy’s distribution list.


