


Crude oil prices have been stuck between $45 and $50 for the past two months. Today, crude oil briefly touched above its August 1 high but failed to hang onto those levels. A late day sell off pushed crude oil prices back to $49.64.
From a bigger picture perspective, the pattern since February 2016 is a bullish pattern that appears incomplete. The models we are following shows a mix of outcomes. Several are showing the low from August 31 as an important medium term low.
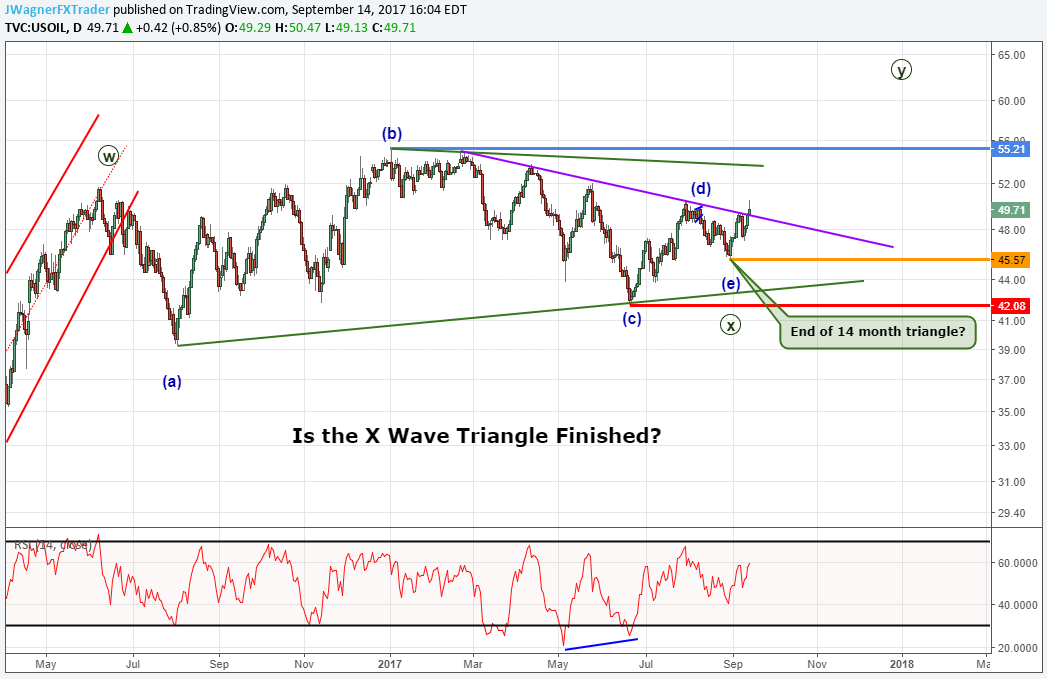
Until the range bound consolidation breaks, we must respect the potential for continued sideways trading. If we do see a follow through breakout to the topside, then crude oil prices may retest the highs above $55.21.
One bullish pattern we are following is that crude oil prices just finished a sideways triangle consolidation on August 31. This would hint suggest prices may break higher to new highs. Look for levels of resistance to break to confirm.
You see, the move from February 2016 to May 2016 is a clear three wave move of equal wave proportions. The long sideways consolidation fits as an ‘X’ wave, which is a common position for Elliott Wave triangles.
If correct, this implies a ‘Y’ wave forth coming that consists of an A-B-C structure. The key level for this immediate bullish outlook is $45.57. So long as prices remain above $45.57, this wave count as pictured remains valid.
Struggling with your trading? You could be making this common trading mistake.
Crude Oil Price Elliott Wave Sept 14
---Written by Jeremy Wagner, CEWA-M
Jeremy is a Certified Elliott Wave Analyst with a Master’s designation. For more learning material on Elliott Wave theory, consider the following:
Beginner and Advanced Guides on Trading with Elliott Wave
Learn more on triangle patterns by viewing this hour-long webinar recording on how to identify and trade triangles...registration required.
Discuss this market with Jeremy in Monday’s US Opening Bell webinar.
Follow on twitter @JWagnerFXTrader .
Join Jeremy’s distribution list.
Other Elliott Wave articles:
Gold Price Analysis: The Bullish Pattern Poised for $1375 Retest


