


Daily
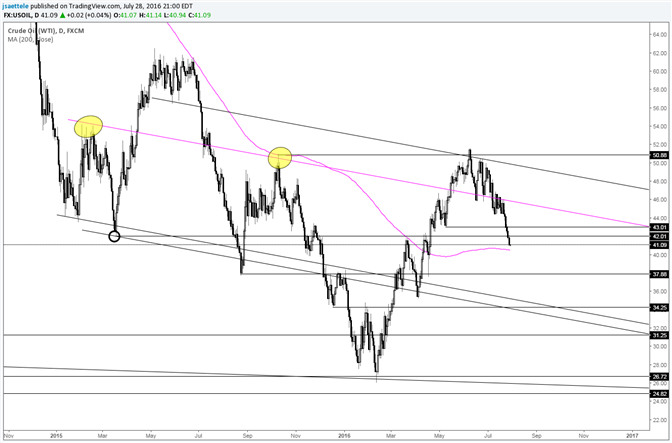
Chart Prepared by Jamie Saettele, CMT
DailyFX Trading Guides and Forecasts
-Recent updates have noted that “the measured target from this breakdown is 41.12, which is just under a chart level at 42 (March 2015 low and March 2016 high).” 41.12 has been reached. The 200 day average, which was resistance in March (and October 2015), is just under the market and should be watched for a reaction. The next chart level of interest is just under 38 (August 2015 low).


