Skip to Content
News & Analysis at your fingertips.

We use a range of cookies to give you the best possible browsing experience. By continuing to use this website, you agree to our use of cookies.
You can learn more about our cookie policy here, or by following the link at the bottom of any page on our site. See our updated Privacy Policy here.

Free Trading Guides
Subscribe
Please try again
Select

Live Webinar Events

0

Economic Calendar Events

0

Notify me about

Live Webinar Events
Economic Calendar Events

H

High

M

Medium

L

Low
More View More
NZD/USD Range Highs and 200 Day Average at .69

NZD/USD Range Highs and 200 Day Average at .69

Jamie Saettele, CMT, Sr. Technical Strategist

Share:

Daily

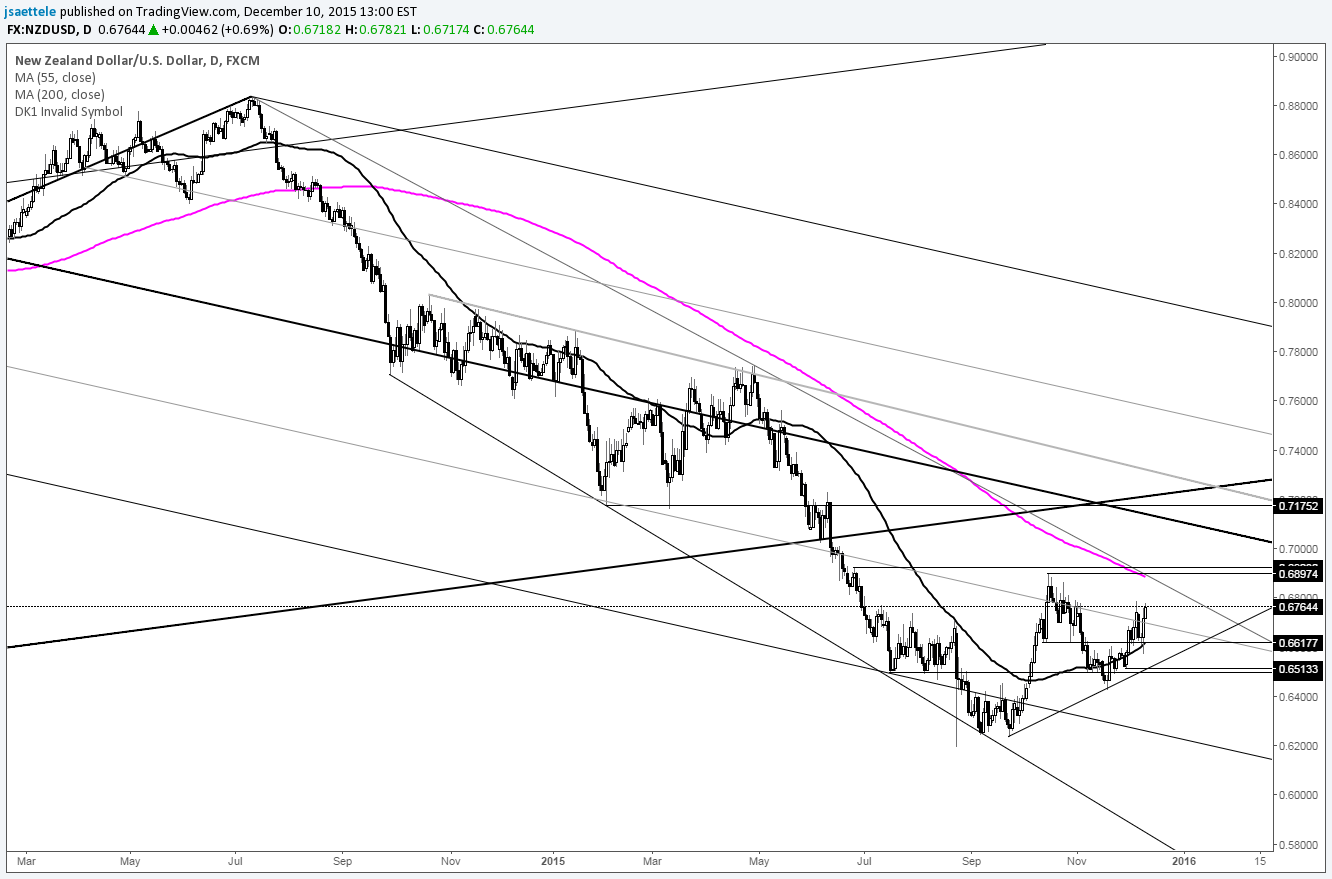
Chart Prepared by Jamie Saettele, CMT

Automate trades with Mirror Trader and see ideas on other USD crosses

-A big reversal may be in the near future for NZD/USD. Price action since July qualifies as an inverse head and shoulders pattern. A break through the October high would confirm the pattern’s completion and set a target (conservative) just above .72. Until the pattern completes, NZD/USD is in a range at best. It’s worth noting as well that the 200 day average is in line with the breakout level near .69.

For more analysis and trade setups (exact entry and exit), visit SB Trade Desk

DailyFX provides forex news and technical analysis on the trends that influence the global currency markets.

DISCLOSURES