Skip to Content
News & Analysis at your fingertips.

We use a range of cookies to give you the best possible browsing experience. By continuing to use this website, you agree to our use of cookies.
You can learn more about our cookie policy here, or by following the link at the bottom of any page on our site. See our updated Privacy Policy here.

0

Notifications

Notifications below are based on filters which can be adjusted via Economic and Webinar Calendar pages.

Live Webinar

Live Webinar Events

0

Economic Calendar

Economic Calendar Events

0
Free Trading Guides
Subscribe
Please try again
More View More
NZD/USD Channel Resistance and 200 Day Average are Near .70

NZD/USD Channel Resistance and 200 Day Average are Near .70

Jamie Saettele, CMT, Sr. Technical Strategist

Daily

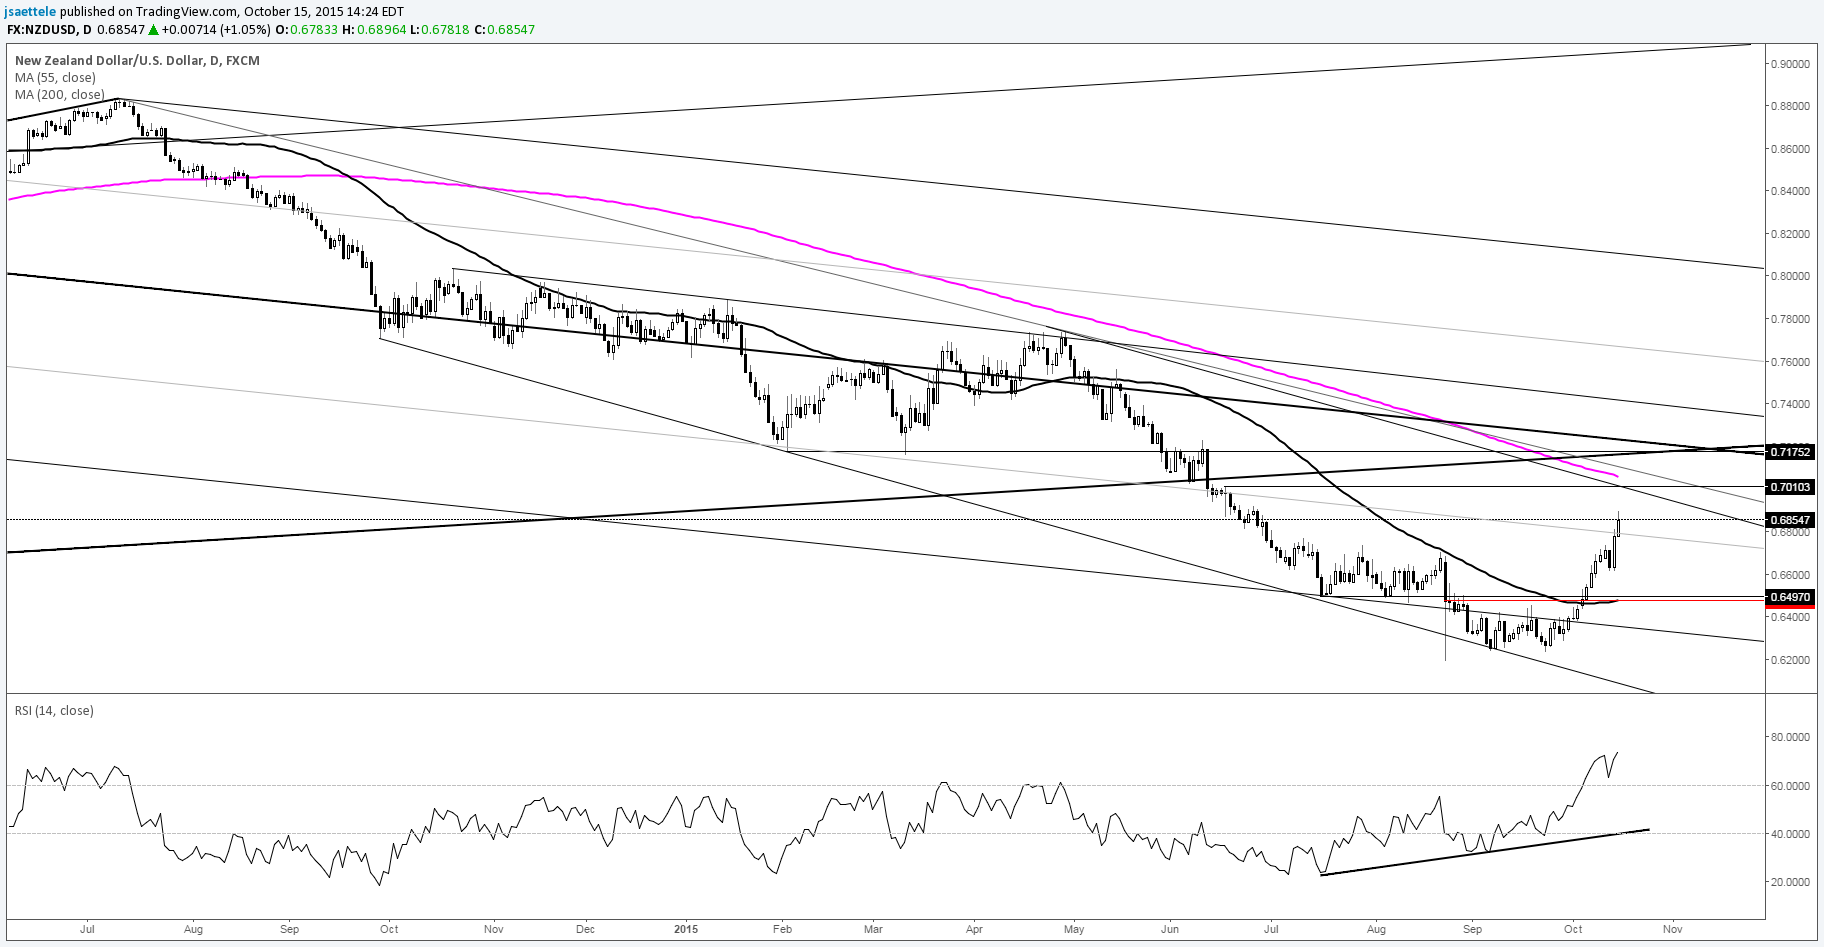
Chart Prepared by Jamie Saettele, CMT

Automate trades with Mirror Trader and see ideas on other USD crosses

-NZD/USD triggered a short term double bottom and blew through the target. Given the long term picture, dips should be bought. There probably isn’t solid resistance (as in a place that could cap the bird for at least several weeks or more) until near .70. .70 represents channel resistance and the 200 day average.

For more analysis and trade setups (exact entry and exit), visit SB Trade Desk

DailyFX provides forex news and technical analysis on the trends that influence the global currency markets.

DISCLOSURES